|
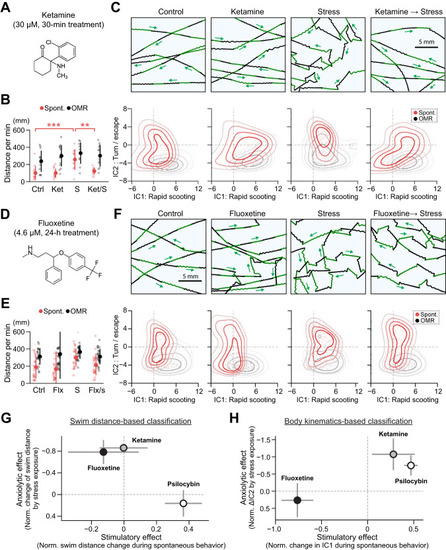
Comparison with fast-acting and slow-acting antidepressants. A Chemical structure and dosage of ketamine (Ket). B Swimming distances during spontaneous exploration (red) and optomotor response (black). N = 12 (C), 14 (Ket), 10 (S) and 12 (Ket/S) fish. ***p = 1.4 × 10⁻⁴ (C vs. S) and **p = 1.7 × 10⁻³ (S vs. Ket/S) from Tukey’s post-hoc test after one-way ANOVA for spontaneous swimming distance. CTop, acute cold shock induced zig-zag swim patterns during optomotor response, and pre-exposure to ketamine prevented such stress-induced behavioral changes. Bottom, independent component analysis (ICA) revealed the shift of swim patterns toward turn/escape behavior (IC2) after cold shock, which was prevented by ketamine. See Fig. S5A for statistical analyses. D Chemical structure and dosage of fluoxetine (Flx). E Swimming distances during spontaneous exploration (red) and optomotor response (black). N = 24 (C), 24 (Flx), 25 (S) and 24 (Flx/S) fish. FTop, acute cold shock induced zig-zag swim patterns during optomotor response, and pre-exposure to fluoxetine did not prevent such stress-induced behavioral changes. Bottom, independent component analysis (ICA) revealed the shift of swim patterns toward turn/escape behavior (IC2) after cold shock. Pretreatment with fluoxetine did not prevent such a shift. See Supplementary Fig. S5B for statistical analyses. G Summary of the behavioral effects of tested antidepressants estimated from changes in spontaneous swimming distances. Stimulatory effects (horizontal axis) were estimated from the change of swimming distance after drug administrations compared to the average of control fish. Anxiolytic effects (vertical axis) were estimated from how much the drug prevented the stress-induced change of spontaneous swimming distance compared to untreated conditions. Error bars represent the standard error of the mean (s.e.m.) across drug-treated fish. See “Methods” for details. H Summary plot of the behavioral effect of tested antidepressants estimated from changes in independent components (IC1, IC2) of body kinematics. Stimulatory effects (horizontal axis) were estimated from the changes along the IC1 axis during spontaneous swimming after drug treatment compared to the average of control fish. Anxiolytic effects (vertical axis) were estimated from how much the drug prevented the stress-induced changes along the IC2 axis compared to untreated conditions during spontaneous swimming. See “Methods” for details.
|