IMAGE

Fig. 1

ID
ZDB-IMAGE-240617-18
Source
Figures for Braun et al., 2024
Image
Figure Caption

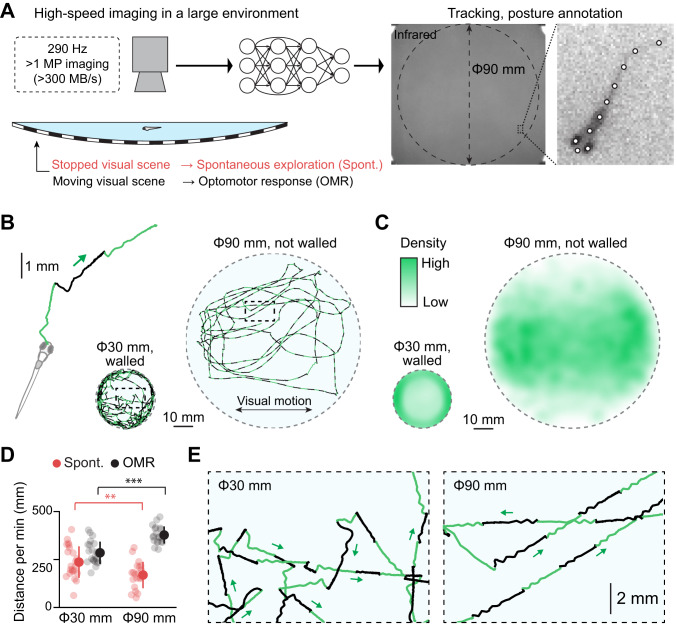
Fig. 1 High-resolution, high-speed tracking of zebrafish behavior in a large environment.

A Schematic illustration of our experimental setup and analysis pipeline. Fish swam in an arena where visual stimuli were projected underneath. We acquired high-resolution images at a speed of 290 Hz across the arena of up to 90 mm in diameter. Data analysis pipelines based on a deep neural network identified the fish loci and body postures. We measured spontaneous exploration while the visual stimuli are stopped (Spont.), and visually-induced optomotor response (OMR) while the visual stimuli are moving. See Fig. S1A and the “Methods” section for details. B Head centroid trajectories in a small, walled environment (30 mm) and a large, unwalled environment (90 mm). Each swim episode is colored in either light green or black to separate different swim episodes visually. C Distributions of head centroids during experiments across tested fish. N = 22 and N = 20 fish for the small and large dishes, respectively. D Swimming distance per minute during spontaneous exploration (red) and optomotor response (OMR, black). Transparent circles represent individual fish. **p = 0.0081; ***p = 1.7 × 10⁶ from 2-sample t-test. Error bars represent standard deviations across tested fish. E Expanded head centroid trajectories from the outlined central parts of the small arena (left) and the large arena (right) from (B). The large environment facilitates straight swim patterns.

Acknowledgments
This image is the copyrighted work of the attributed author or publisher, and ZFIN has permission only to display this image to its users. Additional permissions should be obtained from the applicable author or publisher of the image. Full text @ Mol. Psychiatry