

A set of microphotographs and a graph documenting zebrafish hair cells rescued phenotype in Xanthohumol (XN) treated zebrafish larvae groups after the damage resulting from 40 min 10 μM CuSO4 exposure in 3 dpf Tg(brn3c:GFP) larvae. Images from a to e present L4 neuromast. (a) Control neuromast exhibited normal neuromast rosette with pear shaped cells (yellow arrows). (b) 40 min 10 μM CuSO4 exposure evoked severe hair cell rosette disintegration resulting in the ruptured cell membrane and released cell content (cloud-like appearance) (white arrowheads). (c) In 0.1 μM XN co-treated group the ruptured cell membrane was still present (white arrowheads), however round (white arrow) and pear shaped (yellow arrow) cells were also distinguishable. (d) 0.3 μM XN co-treatment and (e) 0.5 μM XN co-treatment significantly rescued severe phenotype resulting in a greater number of round (white arrow) and pear shaped (yellow arrow) cells. Red arrowheads points to areas within the cells with greater expression of GFP signal, suggesting chromatin condensation (c, d, e). Images from f to i present L4 and L5 neuromasts after an additional 1 h post CuSO4 exposure (red arrows). Images with 1 and 2 numbers correspond to main images and show single neuromasts under 2× magnification. Images with prims show the same elements on black background for better visualization. (f set) CuSO4 exposure resulted in almost no signal derived from persisting hair cells. (g, h, I sets) In XN treated groups the green GFP signal was detectable and the cells become shrunken and round (white arrows). The visualization was accomplished using a Zeiss LSM-700 confocal microscope (10× and 20× objectives). (j) the graph presenting the number of persisting hair cells after XN co-incubation (expressed as the area covered by hair cells) which increased in a dose-dependent manner (one-way ANOVA, GraphPad Prism 5, *** p < 0.001, ** p < 0.01). Scale bar = 10 μm (a-e and images with 1 and 2 numbers and prims). Scale bar = 150 μm (f - i). |

A set of images of L2 neuromast and a graph presenting hair cells regeneration documented at 17 h and 22 h in XN treated group post 40 min CuSO4 treatment in 4 dpf Tg(brn3c:GFP) larvae. (a, a’) control neuromast presenting stable number of hair cells. In experimental groups the time dependent increase in the number of regenerated hair cells was comparable, however XN accelerated the process of regeneration in a dose-dependent manner. The average cell counts were as follow: (b, b’) 3 (17 h) and 4 (22 h) hair cells per neuromast in 10 μM CuSO4 treated group, (c, c’) 6 (17 h) and 8 (22 h) hair cells per neuromast in 0.1 μM XN co-treated group, (d, d’) 7 (17 h) and 9 (22 h) hair cells per neuromast in 0.3 μM XN co-treated group, and (e, e’) 11 (17 h) and 12 (22 h) hair cells per neuromast in 0.5 μM XN co-treated group (Fig. 2e, e’). The visualization was accomplished using a Zeiss LSM-700 confocal microscope (20× objective with 2.5 zoom). (f) the graph presenting the number of hair cells per L2 neuromast after CuSO4 exposure and XN co-incubation (one-way ANOVA, GraphPad Prism 5, *** p < 0.001, ** p < 0.01). Scale bar = 5 μm |

A set of microphotographs and a graph documenting inhibition of neutrophil migration towards 10 μM CuSO4 exposed hair cells resulting from co-treatment of 3 dpf Tg(MPX:GFP) larvae with XN. (a) The control larva presented normal distribution of neutrophils which were found in the ventral myotomes of the trunk and tail. (b) 10 μM CuSO4 exposure evoked the migration of the neutrophils towards the injured neuromasts (arrows). (c,d, e) XN co-treatment resulted in the dose-dependent inhibition of the neutrophil migration, which was reflected by a decreased number, or complete lack of the green fluorescent cells in the area of natural neuromast localization (arrows). The visualization was accomplished using a Zeiss LSM-700 confocal microscope (10× objective with 0.5 zoom). (f) the graph presenting the influence of XN on the total area covered by the neutrophils associated with L3, L4 and L5 neuromasts. XN decreased the number of the immune cells 1.5 fold (0.1 μM XN co-treated group), 3.6 fold (0.3 μM XN co-treated group) and 4.1 fold (0.5 μM XN co-treated group), respectively (one-way ANOVA, GraphPad Prism 5, *** p < 0.001, * p < 0.05, ns –statistically not significant). Scale bare = 100 μm |

A set of images and a graph documenting changes in the phenotype of macrophages recruited to 10 μM CuSO4 derived damaged hair cells of L2, L3 or L4 neuromast resulting from co-treatment of 3 dpf Tg(mpeg1:mcherry) larvae with XN. a) The control larva presented normal distribution of macrophages which were found in the ventral myotomes of the trunk and tail. b) 40 min 10 μM CuSO4 exposure triggered macrophages recruitment towards damaged hair cells, as well resulted in a round shape of immune cells. (c,d, e) XN co-treatment did not altered macrophage recruitment, but resulted in the phenotype switch to the ameboid one. White arrows indicate macrophages clustered around injured L2, L3 or L4 neuromasts. Images with 1 and 2 numbers correspond to the main images and show single neuromasts under 2× magnification. Images with prims show the same elements on the black background for better visualization. The visualization was accomplished using a Zeiss LSM-700 confocal microscope (10× objective). (f) the graph presenting the influence of XN on the total area covered by the macrophages associated with L2, L3 or L4 neuromasts. (g) the graph presenting the influence of XN on CI of macrophages recruited to L2, L3 or L4 neuromasts (one-way ANOVA, GraphPad Prism 5, *** p < 0.001, ** p < 0.01, * p < 0.05, ns –statistically not significant). Scale bar = 50 μm (a-e), scale bar = 25 μm (images with 1 and 2, and prims). |
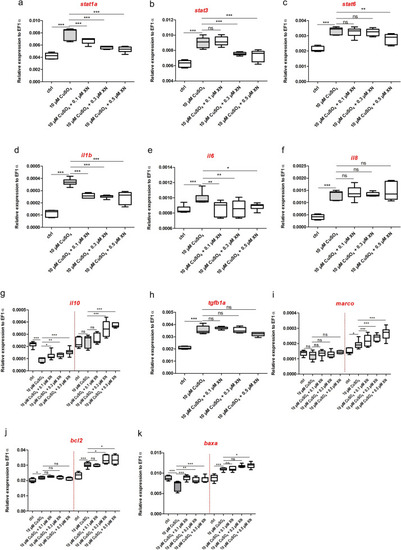
Expression profiles of genes involved in inflammatory response. |