- Title
-
Drugs prescribed for Phelan-McDermid syndrome differentially impact sensory behaviors in shank3 zebrafish models
- Authors
- Kozol, R.A., Dallman, J.E.
- Source
- Full text @ F1000Res
|
Stable shank3ab mutant lines exhibit hyporeactivity and hypoactivity following a light to dark transition. a) shank3ab N-terminal and C-terminal mutants were designed to target regions with known deleterious mutations in individuals with PMS. b) Trace line graphs showing four cycles of 5 minutes lights-on to lights-off. Checkered boxes on the x-axis represent lights on and off. c) Lights on to off paired comparison, highlighting no significant change in activity of shank3ab N terminal mutants during the first 30 sec lights-off. d) Box plots showing first 30 sec lights-off activity. e) Box plots showing activity across the full 5 minutes lights-off. Box plots represent 25th and 75th percentile, and median, with min to max whiskers. Sample sizes: WT = 50, shank3 N = 65, shank3 C = 44. p values; * = p < 0.05, ** = p < 0.01, *** = p < 0.001, **** = p < 0.0001. PHENOTYPE:
|
|
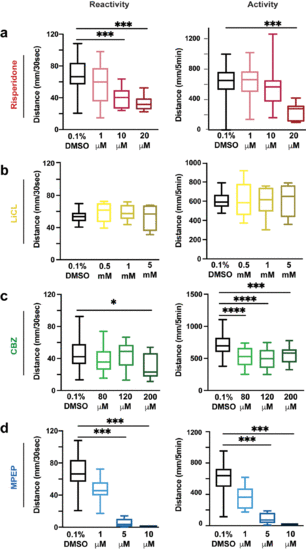
Dose response curves for drugs used in visual motor response assays. a) Risperidone exposure of WT larvae in 1, 10 and 20 μM doses. b) LiCl salt exposure of 0.5, 1 and 5 mM doses. c) CBZ exposure of WT larvae in 80, 120 and 200 μM doses. d) MPEP exposure of WT larvae in 1, 5 and 10 μM doses. Box plots represent 25th and 75th percentile, and median, with min to max whiskers. Sample sizes: WT = 23, WT + risperidone = 24, shank3 N = 33, shank3 N + risperidone = 31, shank3 C = 19, shank3 C + risperidone = 23. p values; * = p < 0.05, ** = p < 0.01, *** = p < 0.001, **** = p < 0.0001. PHENOTYPE:
|
|
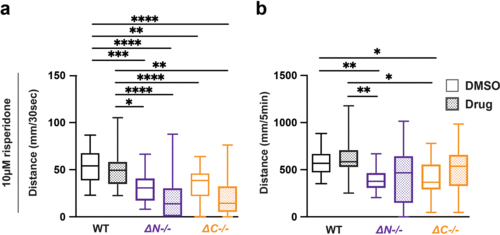
Risperidone exposure normalizes hypoactivity in shank3 mutants following lights-off. a) Activity during the first 30 seconds of lights-off of larvae exposed to 10 μM risperidone. b) Activity during the full 5 minutes lights-off of larvae exposed to 10 μM risperidone. Box plots represents 25th and 75th percentile, and median, with min to max whiskers. Sample sizes: WT = 31, WT + risperidone = 29, shank3 N = 24, shank3 N + risperidone = 23, shank3 C = 25, shank3 C + risperidone = 23. p values; * = p < 0.05, ** = p < 0.01, *** = p < 0.001, **** = p < 0.0001. PHENOTYPE:
|
|
LiCl does not impact lights-off reactivity or activity in wildtype and shank3ab mutants. a) Activity during the first 30 seconds of lights-off of larvae exposed to 5 mM LiCl. b) Activity during the full 5 minutes lights-off of larvae exposed to 5 mM LiCl. Box plots represent 25th and 75th percentile, and median, with min to max whiskers. Sample sizes: WT = 20, WT + risperidone = 16, shank3 N = 18, shank3 N + risperidone = 18, shank3 C = 16, shank3 C + risperidone = 16. p values; * = p < 0.05, ** = p < 0.01, *** = p < 0.001, **** = p < 0.0001. PHENOTYPE:
|
|
CBZ does not impact lights-off reactivity or activity in wildtype and shank3ab mutants. a) Activity during the first 30 seconds of lights-off of larvae exposed to 200 μM CBZ. b) Activity during the full 5 minutes lights-off of larvae exposed to 200 μM CBZ. Box plots represent 25th and 75th percentile, and median, with min to max whiskers. Sample Sizes, WT = 35, WT + CBZ = 37, shank3ab N = 24, shank3ab N + CBZ = 19, shank3ab C = 27, and shank3ab C + CBZ = 34. p values; * = p < 0.05, ** = p < 0.01, *** = p < 0.001, **** = p < 0.0001. PHENOTYPE:
|
|
MPEP exposed wildtype larvae exhibit hyporeactivity and hypoactivity during lights-off conditions. a) Activity during the first 30 seconds of lights-off of larvae exposed to 5 μM MPEP. b) Activity during the full 5 minutes lights-off of larvae exposed to 5 μM MPEP. Box plots represent 25th and 75th percentile, and median, with min to max whiskers. Sample Sizes, WT = 23, WT + MPEP = 24, shank3ab N = 33, shank3ab N + MPEP = 31, shank3ab C = 19, and shank3ab C + MPEP= 24. p values; * = p < 0.05, ** = p < 0.01, *** = p < 0.001, **** = p < 0.0001. PHENOTYPE:
|
|
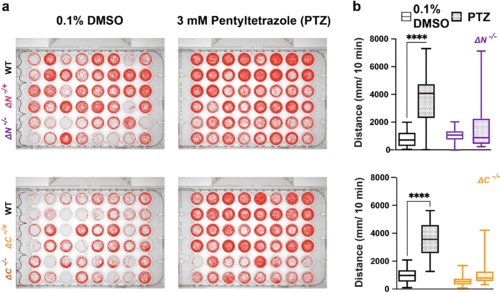
PTZ exposure does not induce seizure-like behavior in shank3 mutants. a) Behavioral traces of larvae exposed to 3 mM PTZ. b) Activity of WT, shank3ab N and shank3ab C larvae for 10 minutes following exposure to 3 mM of PTZ. Box plots: box represents 25th and 75th percentile, and median, with min to max whiskers. Sample sizes for shank3 N trials, WT = 30, shank3 N = 30; for shank3 C trials, WT = 31, shank3 C = 28. p values; * = p < 0.05, ** = p < 0.01, *** = p < 0.001, **** = p < 0.0001. PHENOTYPE:
|


