
- Title
-
Insulin signaling promotes neurogenesis in the brain of adult zebrafish
- Authors
- Gence, L., Fernezelian, D., Meilhac, O., Rastegar, S., Bascands, J.L., Diotel, N.
- Source
- Full text @ J. Comp. Neurol.
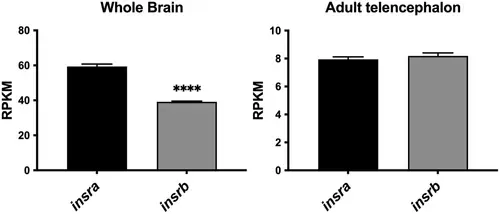
Gene expression of insra and insrb in the whole brain and the telencephalon of adult zebrafish. RNA sequencing data showing the relative gene expression of insulin receptor a (insra) and b (insrb) in the whole brain (n = 4) and the telencephalon (n = 3) of adult zebrafish (data from Gourain et al., 2021; Rodriguez Viales et al., 2015; Wong & Godwin, 2015). RPKM, reads per kilobase per million. Results are expressed as means ± SEM. ****p < .0001 (Student's t-test). |

Specificity of in situ hybridization staining for insra and insrb. Transverse sections of zebrafish brain hybridized with insra and insrb antisense (a) and sense probes (b), with the positive control id1 probe (c). Note that specific signal was detected for the antisense probes and id1 probe while no/little signal was observed for ISH with sense probe. Scale bar = 180 μm. |

Insulin receptors (insra and insrb) are widely expressed in the brain of adult zebrafish within the parenchyma and along the ventricular layers. In situ hybridization for insra and insrb at the level of the telencephalon, diencephalon as well as the medulla oblongata demonstrating insr expression in the brain parenchyma and along the ventricles. The schemes (adapted from the Zebrafish brain atlas; Wulliman et al., 1996) provide the localization of the transversal section performed. Scale bar = 250 μm (a, b), 320 μm (c), 390 μm (d) and 470 μm (e, f, g). |

Insulin receptors (insra and insrb) are expressed in neurons. Fluorescent in situ hybridization for insra (b) and insrb (f) genes on zebrafish brain sections followed by HuC/D immunohistochemistry (green, c and g) to label neurons and DAPI counterstaining (blue, a and e). (d and h) Merged pictures showed the colocalization of insr (red) with HuC/D immunostaining (green) (see arrows). Note that, other cells in the brain parenchyma (HuC/D-negative) also expressed these insr genes (arrowheads). Scale bar = 50 μm. |
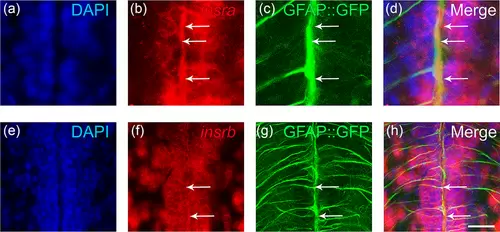
Insulin receptors (insra and insrb) are expressed in neural stem cells. Fluorescent in situ hybridization for insra (b) and insrb (f) genes on brain sections of transgenic tg(GFAP::GFP) zebrafish to label NSCs (green, c and g), using DAPI counterstaining (blue, a and e). (d and h) Merged pictures showed the colocalization of insr (red) with GFAP::GFP staining (green) (see arrows). Scale bar = 30 μm (a–d) and 70 μm (e–h). |

Insulin receptor substrate 1 (irs1) is expressed in the brain parenchyma of adult zebrafish. In situ hybridization for irs1 at the level of the telencephalon, diencephalon as well as the medulla oblongata of adult brain demonstrating irs1 expression in the brain parenchyma and periventricular regions. The schemes (adapted from the Zebrafish brain atlas; Wulliman et al., 1996) provide the localization of the transversal section performed. Scale bar = 240 μm (a, b), 280 μm (c), 370 μm (d), and 370 μm (e, f, g) |
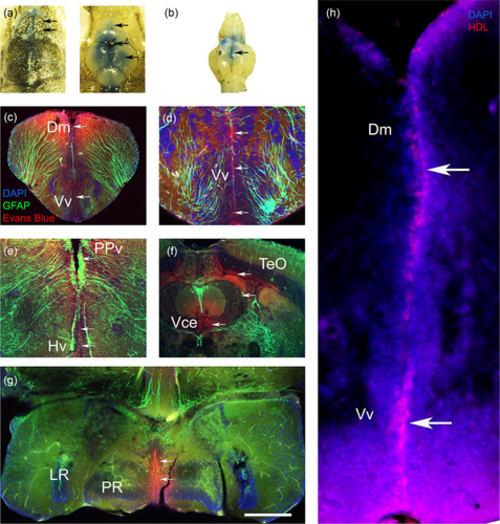
Intracerebroventricular injection leads to diffusion of the injected solution through the ventricular system. (a) Dorsal views before and after dissection of the skull allowing to see the Evans blue ICV injection. Arrows show the diffusion of Evans blue in the telencephalic and ventricle at the level of the optic tectum (TeO). (b) Ventral view showing the diffusion of the Evans blue within the hypothalamic ventricle (Arrow). (c–g) Fluorescence imaging performed in Tg(GFAP::GFP) zebrafish showing Evans blue (red) staining in the ventricle and periventricular layer of the dorsomedian telencephalon (Dm), ventral telencephalon (Vv), periventricular pretectal nucleus (PPv), anterior hypothalamus (Hv), TeO, valvula of the cerebellum (Vce) and caudal hypothalamus around the lateral and posterior recess (LR PR). (h) HDLs labeled with DilC18 (red) demonstrating that the injection at the junction of the telencephalon/rhombencephalon well results in the diffusion of HDLs in the anterior part. Note that cell nuclei are counterstained with DAPI. |

Intracerebroventricular injection of insulin induces constitutive neurogenesis in adult zebrafish. (a) Number of PCNA-positive cells in different neurogenic regions in PBS-injected (Vehicle) and insulin-injected fish. (b) Representative pictures of PCNA immunostaining (red) on zebrafish brain sections at the level of the telencephalon (Vv Vd) and caudal hypothalamus (LR PR) with DAPI counterstaining (blue). Dm, medial zone of dorsal telencephalic area. PPa, parvocellular preoptic nucleus, anterior part. Hv, ventral zone of periventricular hypothalamus. LR, lateral recess of diencephalic ventricle. PPv, periventricular pretectal nucleus, ventral part. PR, posterior recess of diencephalic ventricle. VCe, valvula cerebelli. Results are expressed as means ± SEM (n = 4–6 animals/group). *p < .05, **p < .01 (Student's t-test). Scale bar = 30 μm |

Intracerebroventricular injection did not modulate the recruitment and morphology of microglia. (a) Total number of microglia as well as the number of (b) ramified and (c) ameboid microglia in different neurogenic regions in sham, PBS-injected (PBS) and insulin-injected (INS) fish. Dm, medial zone of dorsal telencephalic area. LR PR, region surrounding the lateral and posterior recess of hypothalamic ventricle. PPv, periventricular pretectal nucleus, ventral part. Vv, ventral nucleus of the ventral telencephalon. Results are expressed as means ± SEM (n = 3–4 animals/group). |
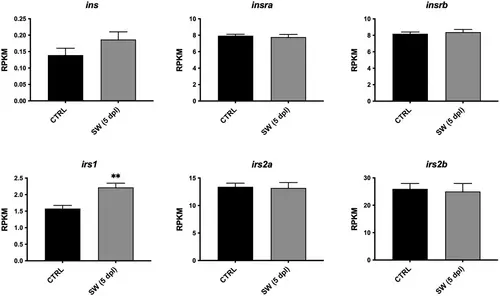
Expression of insulin signaling-related genes in zebrafish brain, 5 days after stab-wound injury. RNA sequencing data showing the relative expression of insulin (ins), insulin receptor a (insra) and b (insrb), insulin receptor substrate 1 (irs1) and 2 (irs2a, irs2b) in the uninjured (CTRL) and injured (SW) hemispheres of adult zebrafish (n = 3), 5 days postlesion (5 dpl) (data from Gourain et al., 2021; Rodriguez Viales et al., 2015). RPKM, reads per kilobase per million. Results are expressed as means ± SEM. **p < .01 (Student's t-test) |
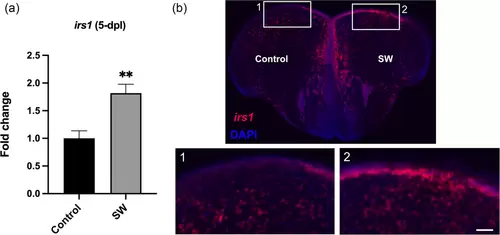
Insulin receptor substrate 1 (irs1) expression is increased 5 days post lesion. Fluorescent in situ hybridization for irs1 (red) of stab-wounded zebrafish with DAPI counterstaining (blue). (a) Quantification of the fluorescent irs1-positive area in the contralateral (Control) hemisphere compared to stab-wounded (SW) hemisphere, 5 days post lesion (5 dpl) (n = 4). (b) Representative picture of a brain section with ISH staining for irs1. Regions of interest (white rectangles) are further magnified in (1 and 2). Results are expressed as mean ± SEM. **p < .01 (Student's t-test). Scale bar = 110 μm (b) and 55 μm (b, high magnification). |