FIGURE SUMMARY
Title

Cooperative contributions of the klf1 and klf17 genes in zebrafish primitive erythropoiesis

Authors
Suzuki, H., Ogawa, T., Fujita, S., Sone, R., Kawahara, A.
Source
Full text @ Sci. Rep.

The klf1-klf17 double mutant exhibited impairment of primitive erythropoiesis. (AD) Live embryos at 48 hpf. The red colour of blood-circulating erythroid cells (arrowheads) was faint in the klf1-klf17 mutant (klf1-/-klf17-/-) (D) compared to those in the wild-type (klf1+/-klf17+/+) (A), klf1 mutant (klf1-/-klf17+/-) (B) and klf17 mutant (klf1+/+klf17-/-) (C). (EH) Detection of haemoglobin (arrowheads) at 48 hpf. Haemoglobin production was examined by o-dianisidine staining. Haemoglobin production in the yolk was reduced in the klf1-klf17 mutant (H) compared to the wild-type (E), klf1 mutant (F) and klf17 mutant (G). Genotyping was performed by genomic PCR using locus-specific primers. Scale bar, 200 μm (A, E).

Primitive myelopoiesis in the klf1-klf17 mutant. (A) Wild-type (klf1+/-klf17+/+), 22 hpf. (B) klf1 (klf1-/-klf17+/+) mutant, 22 hpf. (C) klf17 (klf1+/-klf17-/-) mutant, 22 hpf. (D) klf1-klf17 (klf1-/-klf17-/-) mutant, 22 hpf. Primitive myeloid cells were visualized as lyz:EGFP-positive cells on the yolk and were comparable in the wild-type, klf1 mutant, klf17 mutant and klf1-klf17 mutant (arrowheads). Genotyping of individual embryos was performed by genomic PCR. Scale bar, 200 μm (A).

Blood circulation in wild-type and klf1-klf17 mutant embryos. Fluorescence microscopy images of the wild-type (A, D, F) and klf1-klf17 mutant (B, E, G). Lateral views, with the anterior to the right (A, B, D, E). Ventral views, with the anterior at the top (F, G). (A, B) gata1:mRFP-positive erythroid cells (white arrowheads) in the ICM at 24 hpf. Genotyping of individual embryos was performed by genomic PCR. Scale bar, 200 μm (A). (C) Area existing gata1:mRFP-positive erythroid cells in the ICM at 24 hpf. The area of gata1:mRFP-positive erythroid cells in the ICM was comparable between wild-type (n = 3) and klf1-klf17 mutant (n = 7). The data shown are the mean ± standard deviation (SD). ns, not significant. (D, E) gata1:mRFP-positive erythroid cells (white arrowheads) in the dorsal aorta and gata1:mRFP-positive neurons (asterisks) in the neural tube at 28 hpf. Scale bar, 100 μm (D). (F, G) gata1:mRFP-positive erythroid cells (white arrowheads) on the yolk at 28 hpf. Scale bar, 100 μm (F). (H) Number of gata1:mRFP-positive erythroid cells on the yolk. The number of gata1:mRFP-positive erythroid cells was reduced in the klf1-klf17 mutant (n = 7) compared to that of wild-type (n = 9). The data shown are the mean ± standard deviation (SD). *** P < 0.001 was considered significant.

Wright–Giemsa staining of erythroid cells from wild-type and klf1-klf17 mutant embryos. (A, B) Wright–Giemsa staining at 52 hpf. Erythroid cells in the klf1-klf17 mutant (B) had larger nuclei and more basophilic cytoplasm than wild-type cells (A) at 52 hpf. Scale bar, 10 μm (A). Genotyping was performed by genomic PCR using locus-specific primers. (C) Scatter plots of the nucleus-to-cytoplasm (N:C) ratio in the wild-type (n = 6) and the klf1-klf17 mutant (n = 4) at 52 hpf. The N:C ratio in the klf1-klf17 mutant was larger than that in the wild-type. The central horizontal lines indicate the mean values. The data shown are the mean ± standard deviation (SD). Each wild-type and klf1-klf17 mutant sample contained 10 cells. P < 0.001 was considered significant.

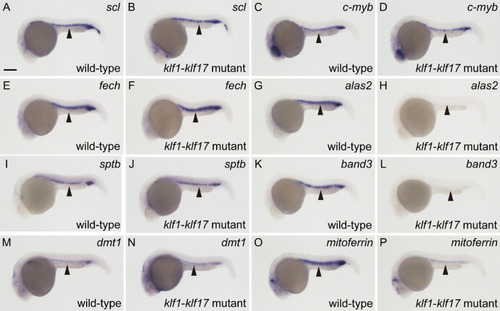
Differential expression of haematopoietic genes in the klf1-klf17 mutant. (A,C,E,G,I,K,M,O) Wild-type embryos with wild-type alleles of klf1 and klf17 at 24 hpf. (B,D,F,H,J,L,N,P) klf1-klf17 mutant at 24 hpf. Whole-mount in situ hybridization (WISH) with scl (A,B), c-myb (C,D), fech (E,F), alas2 (G,H), sptb (I,J), band3 (K,L), dmt1 (M,N) and mitoferrin (O,P). All pictures show lateral views, with the anterior to the left. Scale bar, 200 μm (A). Arrowheads indicate the position of the ICM. The expression of scl, c-myb, fech, sptb and dmt1 at 24 hpf was comparable between the wild-type and klf1-klf17 mutant. In contrast, the expression of alas2, band3 and mitoferrin was decreased in the klf1-klf17 mutant. Genotyping of individual embryos was performed by genomic PCR.

Expression levels of haematopoietic genes in the klf1-klf17 mutant. Quantitative real-time PCR (qPCR) represents the indicated gene expression relative to that of the tubulin α1 (tuba1) gene. alas2, *** p < 0.001. band3, *** p < 0.001. mitoferrin, * p < 0.05. fech, ns, not significant. The results are expressed as the mean ± standard deviation (SD). The fech expression level was comparable between the wild-type and the klf1-klf17 mutant, whereas the expression levels of alas2, band3 and mitoferrin were diminished in the klf1-klf17 mutant.

Acknowledgments
This image is the copyrighted work of the attributed author or publisher, and ZFIN has permission only to display this image to its users. Additional permissions should be obtained from the applicable author or publisher of the image. Full text @ Sci. Rep.