
- Title
-
The Prc and CtpA proteases modulate cell-surface signaling activity and virulence in Pseudomonas aeruginosa
- Authors
- Otero-Asman, J.R., Sánchez-Jiménez, A., Bastiaansen, K.C., Wettstadt, S., Civantos, C., García-Puente, A., Bitter, W., Llamas, M.A.
- Source
- Full text @ iScience

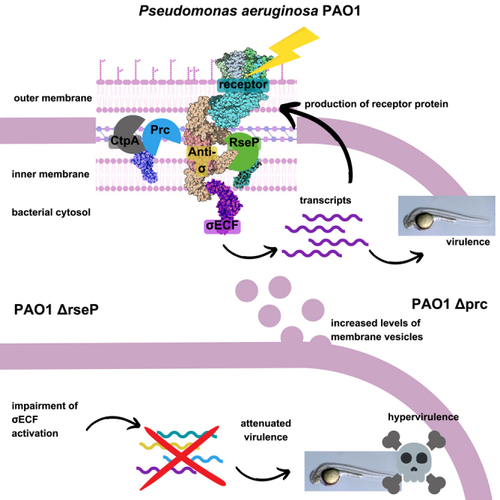
Model of the proteolytic cascade controlling CSS activation based on the P. aeruginosa Fox system (A) The three components of the CSS system—receptor (FoxA), anti-σ factor (FoxR), and σECF (σFoxI)—and the TonB-ExbBD complex are shown. Prior to signal recognition, the P. aeruginosa FoxR anti-σ factor undergoes a spontaneous cleavage that produces two functional N- and C-domains that interact with each other in the periplasm and are both required for proper anti-σ factor function. (B) Recognition of the siderophore ferrioxamine by the FoxA receptor produces the interaction of the TonB protein with FoxA enabling the energy coupled uptake of ferrioxamine. Binding of ferrioxamine to FoxA also promotes the interaction of the signaling domain of FoxA (FoxASD, red ball) with FoxRC. This event triggers the regulated intramembrane proteolysis (RIP) of the FoxRN domain by the action of (at least) two proteases: a (still unidentified) site-1 protease (S1P) and the site-2 RseP protease (S2P). This results in the release of σFoxI into the cytoplasm bound to the anti-sigma domain of FoxR (FoxRASD). In several CSS pathways, including the P. aeruginosa Fox pathway, the ASD persists and is required for σECF activity, having thus pro-σ activity. Although not experimentally demonstrated yet, this domain likely forms part of the transcription complex. Among other genes, σFoxI promotes the transcription of the foxA receptor gene. OM, outer membrane; CM, cytoplasmic membrane; RNAP, RNA polymerase. Adapted from with the findings from.,,, |

Activity of the P. aeruginosa Fox and Fiu CSS systems in ctpA mutants (A and C) β-galactosidase activity of the indicated P. aeruginosa lacZ fusion gene in the PAO1 wild-type strain and the indicated isogenic mutant. Strains were grown under iron-restricted conditions with 1 μM ferrioxamine (PafoxA::lacZ) or 40 μM ferrichrome (PafiuA::lacZ). In (C) strains bear the pBBR1MCS-5 empty (−) or the pBBR/PaCtpA plasmid (Table S1) next to the PafoxA::lacZ fusion, and were grown in iron-restricted conditions without (−) or with (+) ferrioxamine. In (A and C) data are means ± SD from three biological replicates (N = 3). In (A) P-values were calculated by two-tailed t-test by comparing the value obtained in the mutant with that of the PAO1 wild-type strain in the same growth condition and in (C) by one-sample t-test. P-values are represented in the graphs by ns, not significant; ∗, p < 0.05; ∗∗, p < 0.01; ∗∗∗, p < 0.001; and ∗∗∗∗, p < 0.0001. Comparisons between other strains are indicated by brackets. (B) The indicated strains were grown in iron-restricted conditions without (−) or with (+) 1 μM ferrioxamine. Proteins were immunoblotted for FoxA using a polyclonal antibody. Position of FoxA and the molecular size marker (in kDa) is indicated. Blots are representative of three biological replicates (N = 3). The graph shows the intensity of the bands obtained with each strain normalized to the PAO1 strain and data are means ± SD from three biological replicates (N = 3). P-values were calculated by one-sample t-test to a hypothetical value of 100 by comparing the value obtained in the mutant with that of the PAO1 wild-type strain. |

Role of the CtpA protease in processing P. aeruginosa CSS components In all panels, the P. aeruginosa PAO1 wild-type strain and the indicated isogenic mutants were grown to late log-phase under iron-restricted conditions and in the absence (−) or presence (+) of 1 μM ferrioxamine. In (A) strains express an N-terminally HA-tagged P. aeruginosa FoxR protein (HA-PaFoxR), in (B) a C-terminally HA-tagged P. aeruginosa FoxR protein and in (C) a C-terminally HA-tagged Prc protein produced from pMMB67EH or pBBR1MCS-5 derived plasmids (see Table S1). Proteins were immunoblotted for HA using a monoclonal antibody. Position of the protein fragments and the molecular size marker (in kDa) is indicated. Presence of the HA-tag adds ∼1 kDa to the molar mass of the protein fragments. Blots are representative of at least three biological replicates (N = 3). Detection of the OprF protein was used in (A) and (B) as loading control. The graph in (A) shows the ratio between the intensity of the FoxRASD and the FoxRN domain bands, and data are means ± SD from three biological replicates (N = 3). P-values were calculated by two-tailed t-test by comparing the value obtained in the mutant with that of the PAO1 wild-type strain and are represented in the graphs by ns, not significant; ∗, p < 0.05; ∗∗, p < 0.01; ∗∗∗, p < 0.001; and ∗∗∗∗, p < 0.0001. |
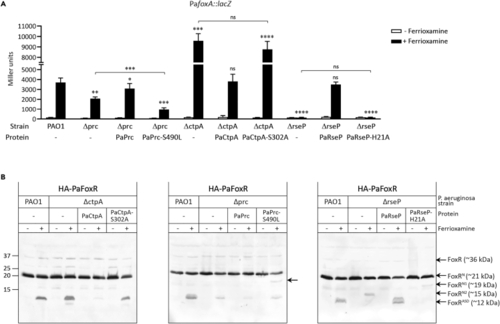
Effect of proteolytic inactive versions of the Prc, CtpA and RseP proteases on CSS activity and FoxR RIP P. aeruginosa PAO1 wild-type strain and its isogenic Δprc, ΔctpA and ΔrseP mutants bearing a pBBR1MCS-5 derivative plasmid expressing the indicated P. aeruginosa protein and protein variant (-, empty plasmid) (Table S1) were grown under iron-restricted conditions without (−) or with (+) 1 μM ferrioxamine. In (A) strains also bear the P. aeruginosa foxA::lacZ fusion gene. β-galactosidase activity was determined as described in Materials and Methods and data are means ± SD from four biological replicates (N = 4). P-values were calculated by two-tailed t-test by comparing the value obtained in the mutant bearing the different protein variants with that obtained in the PAO1 wild-type strain in the same growth condition and are represented in the graphs by ns, not significant; ∗, p < 0.05; ∗∗, p < 0.01; ∗∗∗, p < 0.001; and ∗∗∗∗, p < 0.0001. Comparisons between other strains are indicated by brackets. In (B) strains express an N-terminally HA-tagged P. aeruginosa FoxR protein (HA-PaFoxR). Proteins were immunoblotted for HA using a monoclonal antibody. Position of the protein fragments and the molecular size marker (in kDa) is indicated. Presence of the HA-tag adds ∼1 kDa to the molar mass of the protein fragments. Blots are representative of at least three biological replicates (N = 3). |

P. aeruginosa infections in zebrafish embryos and in the A549 cell line (A) Kaplan-Meier zebrafish embryo survival curves on infection with P. aeruginosa. One-day-old embryos were injected with ∼700–1000 CFU of the P. aeruginosa PAO1 wild-type strain or with the indicated isogenic mutant. Uninfected control (non-injected) is shown. Data are means ± SD of four biologically independent replicates (N = 4) with ∼20 embryos/group in each replicate. The hazard ratio (HR), the 95% confidence interval ratio (95% CI), and the P-values (Log Rank Mantel-Cox) of each curve with respect to the reference PAO1 curve (HR = 1) are indicated. (B) A549 cell viability. The P. aeruginosa PAO1 wild-type strain and the indicated isogenic mutant were co-incubated with the eukaryotic cells. Formazan production on addition of the MTT tetrazolium salt was determined spectrophotometrically at 620 nm. Uninfected cells (white bar) were used as control. Data are means ± SD from five biological replicates (N = 5). P-values were calculated by two-tailed t-test and are represented in the graphs by ns, not significant; ∗, p < 0.05; ∗∗, p < 0.01; ∗∗∗, p < 0.001; and ∗∗∗∗, p < 0.0001. Brackets indicate the comparison to which the P-value applies. |

P. aeruginosa membrane vesicles (MVs) production and role of the Prc protease P. aeruginosa PAO1 wild-type strain, the isogenic Δprc mutant, and the Δprc mutant bearing the pBBR/PAPrc plasmid (Table S1) (Δprc + Prc) were grown to exponential phase. (A) Membrane vesicle (MV) proteins were isolated and visualized by Coomassie staining. Molecular size marker (in kDa) is indicated. SDS-PAGE is representative of three biological replicates (N = 3). (B) Strains were negatively stained with phosphotungstic acid. TEM images were taken in several fields at 6.000 x and 25.000 x. Images are representative of three biological replicates (N = 3). |
|