
- Title
-
Comparative single-cell profiling reveals distinct cardiac resident macrophages essential for zebrafish heart regeneration
- Authors
- Wei, K.H., Lin, I.T., Chowdhury, K., Lim, K.L., Liu, K.T., Ko, T.M., Chang, Y.M., Yang, K.C., Lai, S.L.
- Source
- Full text @ Elife

Transcriptional profiling of infarcted hearts under regenerative and macrophage-delayed conditions. (A) Experimental design. Zebrafish AB_wildtype was IP-injected with PBS or clodronate liposomes (CL) 1 d before cardiac cryoinjury. Injured hearts were collected at 7 and 21 days post cryoinjury (dpci), respectively. Uninjured hearts were collected as the control of the baseline. Total RNA was extracted and analyzed by RNA sequencing (RNAseq). (B) Principal component analysis (PCA) of gene expression in hearts at different time points. The PCA was performed on the FPKM normalized datasets of healthy hearts and injured hearts at 7 and 21 dpci after PBS or CL treatments (PBS7d, PBS21d, CL7d, and CL21d). The datasets of 0 hr, 6 hr, 1d, 2d, 3d, and 5 dpci from the previous study were also included (Lai et al., 2017). Regeneration and delayed dynamics are indicated by purple and green lines, respectively. FPKM, Fragments Per Kilobase of transcript per Million mapped reads. (C) Hierarchical clustering heatmap of the comparatively DEGs under regenerative and macrophage-delayed conditions in zebrafish. The DEGs were selected by NOIseq (q > 0.99) and arranged by hierarchical clustering from cluster 1 (C1) to cluster 22 (C22) (left panel). The value was a z-score from 1.5 as red to –1.5 as blue. BP of GO and KEGG pathways of the DEGs were analyzed by using WebGestalt (right panel). Cluster-enriched genes involved in their predicted biological processes and pathways were listed. The threshold of enriched categories was FDR < 0.05. DEGs, differentially expressed genes; GO, Gene Ontology; BP, biological process; KEGG, Kyoto Encyclopedia of Genes and Genomes; FDR, false discovery rate. |

Identification of canonical pathways and upstream regulators under regenerative and macrophage-delayed conditions ( |
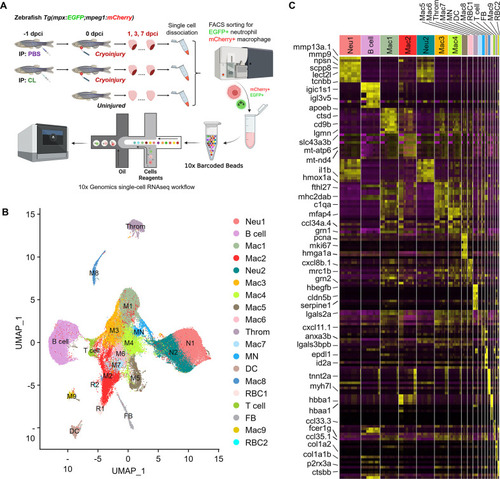
Temporal single-cell analyses revealed heterogeneous macrophages and neutrophils in the infarcted hearts. (A) Experimental design. Double transgenic Tg(mpx:EGFP;mpeg1:mCherry) zebrafish expressing EGFP in neutrophils and mCherry in macrophages were IP-injected with PBS (regenerative condition) or CL (macrophage-delayed condition) 1 d before cryoinjury (–1 dpci, –1d_CL). Injured hearts were collected and dissociated into single cells at 1, 3, and 7 days post cryoinjury (dpci). Untreated and uninjured hearts were also collected and dissociated. Single cells of each time point were then subjected to a fluorescence-activated cell sorter (FACS) for isolating the mCherry+ and EGFP+ cells. RNA was purified from these cells and barcoded followed by single-cell RNA sequencing (scRNAseq). (B) Uniform Manifold Approximation and Projection (UMAP) of the isolated cells. The isolated cells consisted of nine macrophage clusters, two neutrophil clusters, one hybrid cluster (MN), and other minor populations including B cell, thrombocyte (Throm), dendritic cell (DC), T cell, fibroblast (FB), and two red blood cell (RBC) clusters. (C) Heatmap of top 10 DEGs in 19 clusters of infarcted hearts. Yellow highlights the cluster-enriched genes with gene names listed on the left. DEGs, differentially expressed genes. |

Dynamics of macrophages and neutrophils in zebrafish heart prior and post injury. ( |

Quality controls for all the scRNAseq datasets by Seurat ( |

Expression of marker genes visualized on Uniform Manifold Approximation and Projection (UMAP) plots. ( |
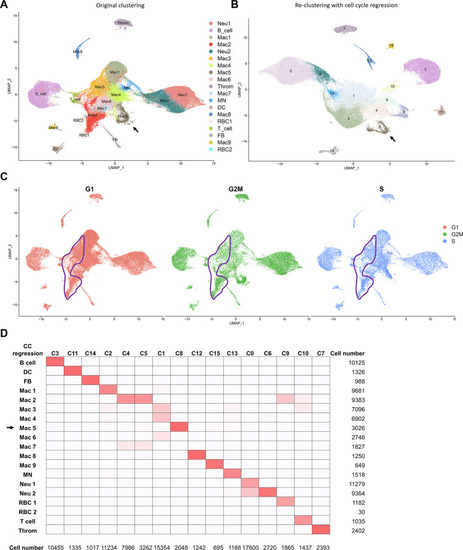
Cell-cycle scoring and regression of cell clusters revealed by scRNAseq. ( |
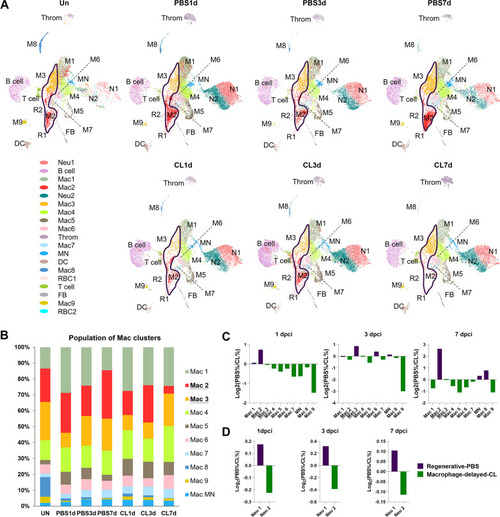
Temporal cell proportion analyses of inflammatory cells identified resident macrophage clusters enriched in regenerative conditions. Differential proportion analyses of macrophage and neutrophil clusters under regenerative or macrophage-delayed conditions. (A) Split view of Uniform Manifold Approximation and Projection (UMAP) plots of major macrophage (Mac) and neutrophil (Neu) clusters as well as minor inflammatory cell clusters from uninjured (UN) and infarcted hearts under regenerative (PBS) or macrophage-delayed (CL) conditions. Mac 2 and Mac 3 clusters were the major resident macrophages enriched in regenerative conditions (delineated by purple lines), and they either dramatically decreased or barely recovered in non-regenerative conditions. (B) The stacked bar chart shows the percentage of macrophage clusters at each time point and condition. (C, D) Cell proportion analyses identified the regenerative-associated clusters (purple) and macrophage-delayed-associated clusters (green) of macrophages (C) and neutrophils (D). Proportion of each cell clusters under regenerative conditions vs. macrophage-delayed conditions are shown by log2 ratio. |

Representative genes expressed in the major resident macrophage clusters Mac 2 and Mac 3 of infarcted heart. ( |

Differential gene expression in respective inflammatory cell clusters toward regenerative vs. macrophage-delayed conditions revealed alternative activation of both macrophages and neutrophils. Hierarchical clustering of the condition-enriched DEGs between PBS and CL conditions of each macrophage and neutrophil cluster. PBS-enriched and CL-enriched genes are highlighted in red and blue, respectively. D1–D17 represent the dendrogram cut of the hierarchical clustering. BP of GO and KEGG pathways were identified from the DEGs in respective dendrograms. Regenerative and macrophage-delayed associated dendrograms are labeled by purple and green, respectively. DEGs, differentially expressed genes; GO, Gene Ontology; BP, biological process; KEGG, Kyoto Encyclopedia of Genes and Genomes. |

Expression pattern of classical macrophage polarization genes and the alternatively activated genes between Neu 1 and Neu 2. ( |

Cell–cell interactions between macrophages and neutrophils are altered in macrophage-delayed conditions. Crosstalk analyses identify hypothetical cell–cell interactions in macrophage and neutrophil clusters under regenerative (PBS) or macrophage-delayed (CL) conditions. (A, B) Putative interaction maps of macrophage-expressing ligands and neutrophil-expressing receptors among cell clusters at 3 days post cryoinjury (dpci) (A) and 7 dpci (B). Purple and green highlight the ligand–receptor pairs found specifically under PBS- or CL-treated conditions. Direction of arrows indicates the ligands signaling to the receptors in responding clusters. Circle size represents the numbers of ligand/receptor genes. Ligand–receptor pairs of the resident population Mac 2 and 3 to neutrophil clusters at 3 dpci (A’, A’’) and 7 dpci (B’, B’’) are shown. (C, D) Putative interaction maps of neutrophil-expressing ligands and macrophage-expressing receptors between clusters at 3 dpci (C) and 7 dpci (D). Purple and green highlight the ligand–receptor pairs found specifically under PBS- or CL-treated conditions. Direction of arrows indicates the ligands signaling to the receptors in responding clusters. Circle size represents the numbers of ligand/receptor genes. (C’, C’’) Ligand–receptor pairs of Neu 1, 2 to major macrophage responders at 3 dpci. (D’, D’’) Ligand–receptor pairs of Neu 1, 2 to major macrophage responders at 7 dpci. |

Pseudotemporal trajectory analyses identify distinct progression routes and enriched genes among macrophage and neutrophil subpopulations ( |
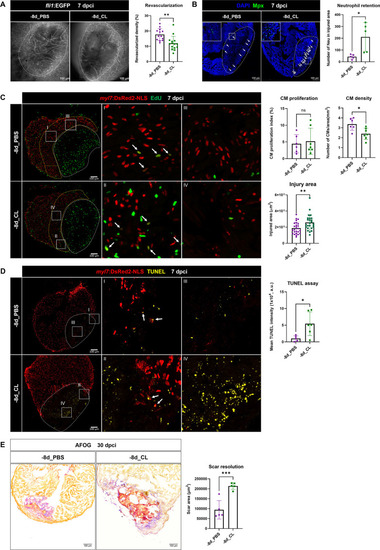
Depletion of resident macrophages compromised heart regeneration. Functional validation of resident macrophage depletion in cardiac repair. Zebrafish were IP-injected with PBS or CL at 8 d before cardiac injury (–8d_PBS or –8d_CL). (A) Revascularization was evaluated at 7 days post cryoinjury (dpci). Endogenous fli1:EGFP fluorescence depicts the vascular endothelial cells. White dotted lines delineate injury areas; scale bars, 100 μm. Quantification of vessel density by ImageJ is shown in the right panel (n ≥ 13; p=0.0015). (B) Neutrophils in injured areas were examined by Myeloperoxidase (Mpx) immunostaining. White dotted lines delineate injury areas; scale bars, 100 μm. Quantification of neutrophil number in injured areas is listed in the right panel (n = 5; p=0.0359). (C) CM proliferation was assessed by EdU cell proliferation assay at 7 dpci. White dotted lines delineate injury areas; scale bars, 100 μm (left panels). White arrows point out the proliferating CMs (insets I and II). myl7:DsRed-NLS served as the endogenous CM nuclear marker. The shape of CMs became smaller and DsRED fluorescence was weaker in CL-pretreated hearts (–8d_PBS vs. –8d_CL, insets III vs. IV). Quantification of the injured area (n = 25; p=0.0061), along with the CM density (n ≥ 6; p=0.0131) and CM proliferation index (n ≥ 6; p=0.6990) in 200 μm adjacent to the injured area (border zone, delineated by yellow dotted lines) are shown in right panels. (D) TUNEL assay was performed on the same batch of cryosections, which identified the CMs lost in the border zone (insets I and II) at 7 dpci. White arrows point out the TUNEL-positive CMs in the area; scale bars, 100 μm (left panels). More damaged nuclei were found in CL-treated hearts than in PBS controls (inset III and IV). Quantification of TUNEL intensity is listed in the right panel (n ≥ 5; p=0.0269). (E) Scar resolution was evaluated by Acid Fuchsin Orange G (AFOG) staining at 30 dpci. AFOG staining visualized healthy myocardium in orange, fibrin in red, and collagen in blue. Quantification of scar area is shown in the right panel (n = 5; p=0.0006). CL, clodronate liposomes; IP, intraperitoneal; CM, cardiomyocyte. The heart samples under regenerative (–8d_PBS) or resident macrophage-deficient (–8d_CL) conditions are indicated by purple or green, respectively. Student’s t-test was used to assess all comparisons by Prism 9. |

Specific resident macrophage clusters Mac 2 and 3 were non-recoverable after CL-mediated depletion. ( |
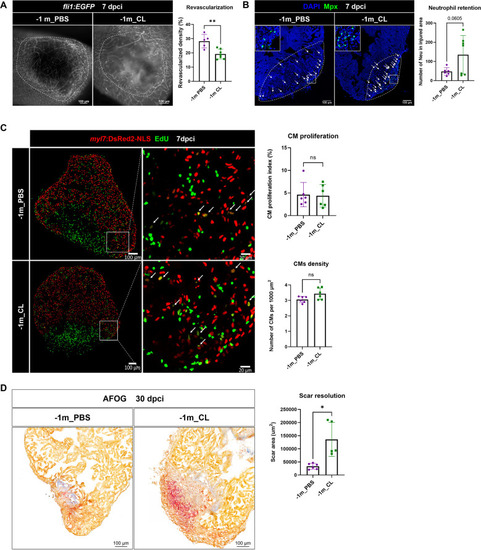
Depletion of resident macrophages led to long-term incompetence of heart regeneration. Long-term effect of resident macrophage depletion by injecting CL at 1 mo (–1 m_CL) prior cardiac injury. ( |

Resident macrophages Mac 2 express Reduced |