
|
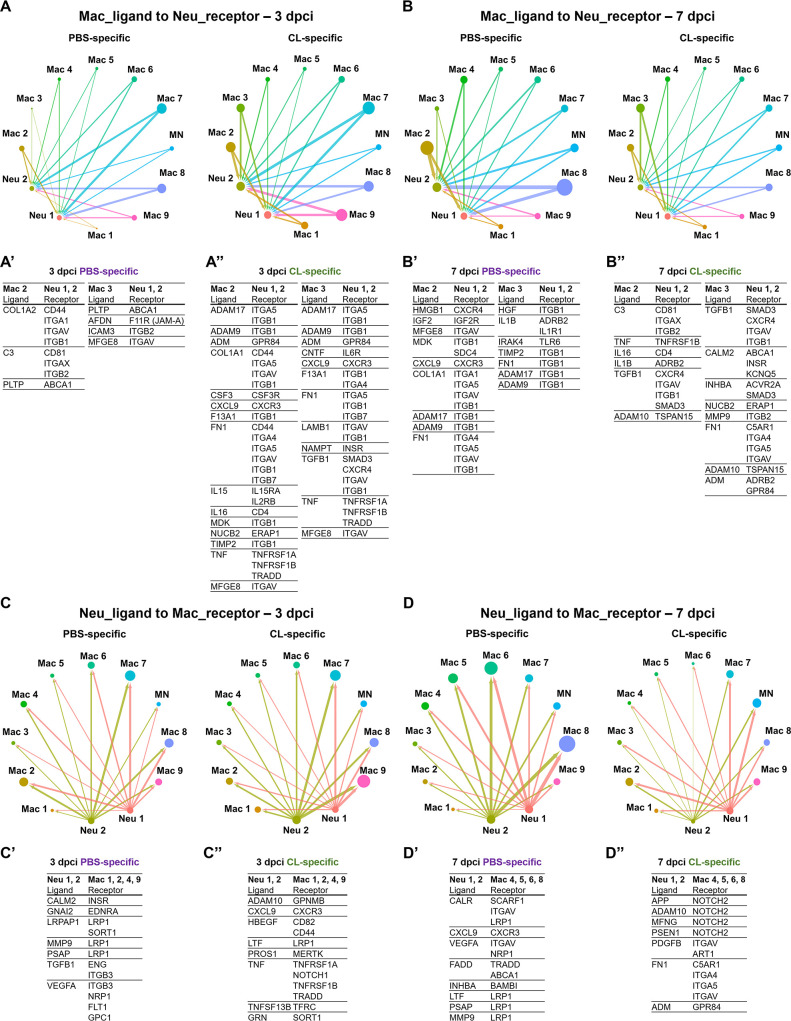
Figure 5 Cell–cell interactions between macrophages and neutrophils are altered in macrophage-delayed conditions. Crosstalk analyses identify hypothetical cell–cell interactions in macrophage and neutrophil clusters under regenerative (PBS) or macrophage-delayed (CL) conditions. (A, B) Putative interaction maps of macrophage-expressing ligands and neutrophil-expressing receptors among cell clusters at 3 days post cryoinjury (dpci) (A) and 7 dpci (B). Purple and green highlight the ligand–receptor pairs found specifically under PBS- or CL-treated conditions. Direction of arrows indicates the ligands signaling to the receptors in responding clusters. Circle size represents the numbers of ligand/receptor genes. Ligand–receptor pairs of the resident population Mac 2 and 3 to neutrophil clusters at 3 dpci (A’, A’’) and 7 dpci (B’, B’’) are shown. (C, D) Putative interaction maps of neutrophil-expressing ligands and macrophage-expressing receptors between clusters at 3 dpci (C) and 7 dpci (D). Purple and green highlight the ligand–receptor pairs found specifically under PBS- or CL-treated conditions. Direction of arrows indicates the ligands signaling to the receptors in responding clusters. Circle size represents the numbers of ligand/receptor genes. (C’, C’’) Ligand–receptor pairs of Neu 1, 2 to major macrophage responders at 3 dpci. (D’, D’’) Ligand–receptor pairs of Neu 1, 2 to major macrophage responders at 7 dpci.