FIGURE SUMMARY
Title

Wdr5-mediated H3K4me3 coordinately regulates cell differentiation, proliferation termination, and survival in digestive organogenesis

Authors
Zhang, Z., Yang, C., Wang, Z., Guo, L., Xu, Y., Gao, C., Sun, Y., Zhang, Z., Peng, J., Hu, M., Jan Lo, L., Ma, Z., Chen, J.
Source
Full text @ Cell Death Discov

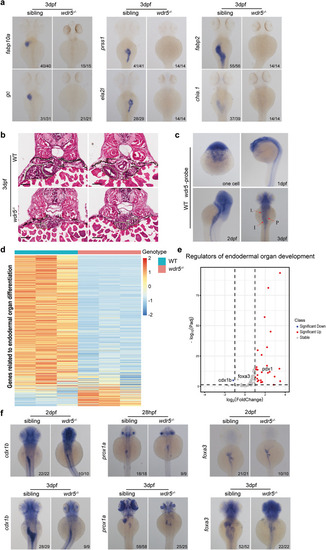
The differentiation of intestine, liver, and exocrine-pancreas is impaired in wdr5/− mutant embryos

a Whole-mount in situ hybridization (WISH) of wild type (WT) and wdr5/− mutant embryos at 3 dpf to show the expression of differentiation genes for different digestive organs including: the fabp10a and gc for liver, prss1and ela2l for exocrine pancreas, fabp2 and chia.1 for intestine as indicated. b Hematoxylin-Eosin (H&E) staining of cryosections to show liver (L), intestine (I) and exocrine pancreas (P) in WT and wdr5−/− mutant embryos at 3 dpf. Scale bar: 40 μm. c WISH of wdr5 in WT at one cell stage, 1, 2 and 3 dpf. d Heatmap of genes related to endodermal organ differentiation in WT and wdr5−/− mutant embryos at 3 dpf. e Volcano plot to show differential expressed regulators of endodermal organ development between WT and wdr5/− mutant embryos at 3 dpf (wdr5−/− mutant vs WT, |log2FoldChange | ≥ 1, Padj < 0.05). f WISH of WT and wdr5−/− mutant embryos at different time points with different digestive organ development regulators including: pan-endodermal marker foxa3, hepatic marker prox1a and intestine marker cdx1b as indicated. n indicates the number of zebrafish embryos in each group.

Wdr5 promotes the differentiation of digestive organs through H3K4me3, but not H4K16ac.

a Western blot of H3K4me3 in WT and wdr5−/− mutant embryos at 3 dpf. Relative intensity of H3K4me3 was normalized with H3. b Western blot of H4K16ac in WT and wdr5−/− mutant embryos at 3 dpf. Relative intensity of H4K16ac was normalized with H3. c Cryosections of WT and wdr5/− mutant embryos at 3 dpf were immunostained by anti-H3K4me3 (in red). The nuclear was stained with DAPI (in blue). L: liver; I: intestine; P: pancreas. Scale bar: 40 μm. d Venn diagram showing 953 overlapping downregulated genes between RNA-seq (wdr5−/− mutant vs WT, log2FoldChange ≤ −1, Padj < 0.05) and H3K4me3 ChIP-seq (wdr5−/− mutant vs WT, log2FoldChange ≤ −0.58, Padj < 0.05). e KEGG analysis of overlapping downregulated genes between RNA-seq and H3K4me3 ChIP-seq in d. f Distribution of H3K4me3 peak changes (wdr5−/− mutant vs WT, |log2FoldChange | ≥ 0.58, Padj < 0.05) in 239 downregulated genes (wdr5−/− mutant vs WT, log2FoldChange ≤ −1, Padj < 0.05) enriched in digestive organs such as liver, intestine and exocrine pancreas. g Graphs showing H3K4me3 and RNA peaks at apom and ebp loci in WT and wdr5−/− mutant embryos at 3 dpf. h WISH of apom and ebp in WT and wdr5−/ mutant at 3 dpf. Each experiment was repeated for three times with similar results and a representative was showed here. n indicates the number of zebrafish embryos in each group. Data are mean ± S.D. Two-tailed t-test was applied for each individual comparison (**p < 0.01; n.s no significance).

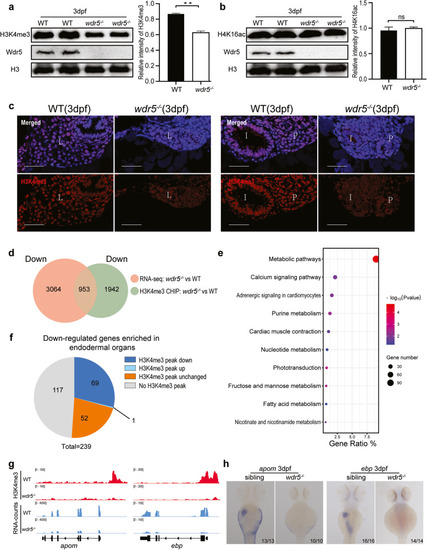
Wdr5-mediated H3K4me3 is required for digestive organ differentiation.

a Two transgenic lines of Tg(hsp70:HA-Wdr5WT) and Tg(hsp70:HA-Wdr5S91K,F133A,Y191F) were treated with heat shock. Two transgenes of Tg(hsp70:HA-Wdr5WT) and Tg(hsp70:HA-Wdr5S91K,F133A,Y191F) were generated in wdr5+/ background. The upper diagram showing how the heat shock treatment was performed. The embryos crossed from each transgenic line were treated with four times of heat shock (39 °C for half an hour) at 1, 1.5, 2, and 2.5 dpf, respectively. The treated embryos were sampled at 3 dpf. Representative images were taken before the genotyping. b Co-IP analysis of the interaction between HA-Wdr5 and H3, H3K4me3 or H4K16ac in two transgenetic lines: Tg(hsp70:HA-Wdr5WT) and Tg(hsp70:HA-Wdr5S91K,F133A,Y191F) under heatshock condition. HA beads were used for immunoprecipitation. β-Actin and β-Tubulin were used as the interaction negative and positive controls, respectively. More than 300 embryos of 1 dpf from each line were treated with heat shocks as described in Fig. 3a. c Co-IP of the interaction between Flag-N-Setd1a or Flag-Rbbp5 with the HA-Wdr5WT or HA-Wdr5S91K,F133A,Y191F in 293 T cells. The upper diagram showing Flag-tagged N terminal of zebrafish Setd1a protein used in Co-IP. Different plasmids were transfected or co-transfected into 293 T cells as indicated. HA beads were used for immunoprecipitation. A zebrafish Wdr5 antibody was used to detect HA-Wdr5WT or HA-Wdr5S91K,F133A,Y191F. Flag antibody was used to detect Flag-Rbbp5 and Flag-N-Setd1a. d Western blots detected by anti-Wdr5, anti-HA, anti-H3K4me3 or anti-H3 antibody in different samples as indicated. Two transgenic lines Tg(hsp70:HA-Wdr5WT) and Tg(hsp70:HA-Wdr5S91K,F133A,Y191F) were generated in wdr5+/ background. More than 200 embryos of 1 dpf from each line were treated with heat shocks as described in Fig. 3a. Treated embryos were genotyped before protein extraction. At least 30 embryos in each group were pooled together for protein extraction. e WISH of fabp10a in transgenic wdr5−/− and sibling embryos treated with heat shocks as described in Fig. 3a. Each experiment was repeated for three times with similar results and a representative was showed here. n indicates the number of zebrafish embryos in each group.

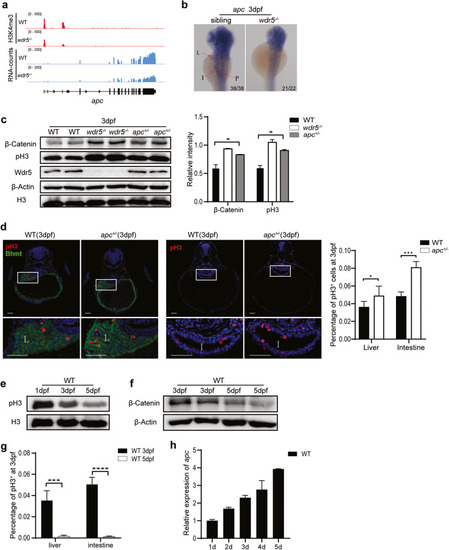
Overactivation of Wnt/β-Catenin signal is responsible for the increase of cell proliferation in wdr5−/ mutant digestive organs.

a Western blots of pH3, Wdr5, β-Actin, H3 in WT and wdr5−/− mutant embryos at 3 and 5 dpf. Relative intensity of pH3 was normalized with H3. b Cryosections of WT and wdr5−/− mutant embryos at 3 and 5 dpf were immunostained by anti-pH3 (in red) anti-Bhmt (a liver specific marker in green). The nuclear was stained with DAPI (in blue). L: liver; I: intestine. Framed area was magnified in bottom panel. Scale bar: 40 μm. The percentage of pH3 positive cells in each sample was calculated as the number of pH3 positive cells divided by total cell number in different organs from continuous cryosections. Also see Supplementary Fig. 6b. c Transcript TPM of β-Catenin targeted genes (myca, mycb, mycn and ccnd1) in RNA-seq from WT and wdr5−/− mutant embryos at 3 dpf. d Western blots of β-Catenin, Wdr5, β-Actin, in WT and wdr5−/− mutant embryos at 3 dpf. Relative intensity of β-Catenin was normalized with β-Actin. e Western blots of β-Catenin, pH3, Wdr5, β-Actin and H3 in WT and wdr5−/ mutant embryos with different treatment as indicated. The wdr5−/− mutant and WT embryos at 2.3 or 4 dpf were treated with SAL or DMSO. The protein was extracted from treated embryos at 3 and 5 dpf. Also see Supplementary Fig. 6d, e. f Relative expression level of myca and ccnd1 in WT and wdr5−/− mutant embryos at 3 dpf with SAL or DMSO. The treatment was described in Fig. 4e. g Cryosections of WT and wdr5−/− mutant embryos at 3 dpf treated with SAL or DMSO were immunostained by anti-pH3 (in red) and anti-Bhmt (in green). The nuclear was stained with DAPI (in blue). L: liver; I: intestine. Framed area was magnified in bottom panel. Scale bar: 40 μm. Statistical analysis on the percentage of pH3 positive cells in the liver or intestine of wdr5−/− embryos at 3 dpf treated with SAL or DMSO was showed in the right panel. The treatment was described in Fig. 4e. Each experiment was repeated for three times with similar results and a representative was showed here. n indicates the number of zebrafish embryos in each group. Data are mean±S.D. Two-tailed t-test was applied for each individual comparison (*p < 0.05; **p < 0.01; ***p < 0.001; ****p < 0.0001; n.s no significance).

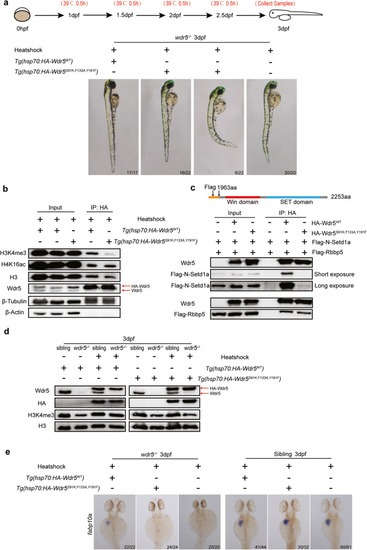
Wdr5-mediated H3K4me3 upregulates apc expression to inhibit Wnt/β-Catenin signal.

a Graphs showing H3K4me3 and RNA peaks at apc locus in WT and wdr5−/− mutant embryos at 3 dpf. b WISH of apc in WT and wdr5/− mutant at 3 dpf. L: liver; I: intestine; P: pancreas. c Western blots of β-Catenin, pH3, Wdr5, β-Actin and H3 in WT, wdr5/− and apc+/− embryos at 3 dpf. Relative intensities of β-Catenin and pH3 in WT, wdr5−/− and apc+/− from the western blots were normalized with H3 was showed in right panel. d Cryosections of WT and apc+/− embryos at 3 dpf were immunostained by anti-pH3 (in red) and anti-Bhmt (in green). The nuclear was stained with DAPI (in blue). L: liver; I: intestine. Framed area was magnified in bottom panel. Scale bar: 40 μm. Statistical analysis on the percentages of pH3 positive cells in the liver or intestine between WT and apc+/ embryos at 3 dpf was showed in the right panel. e Western blots of pH3 and H3 in WT embryos at 1 dpf, 3 dpf and 5 dpf. f Western blots of β-Catenin and β-Actin in WT embryos at 3 dpf and 5 dpf. g Statistical analysis on the percentages of pH3 positive cells in liver and intestine of WT between 3 dpf and 5 dpf. h Relative expression of apc in WT embryos from 1–5 dpf. Each experiment was repeated for three times with similar results and a representative was showed here. n indicates the number of zebrafish embryos in each group. Data are mean±S.D. Two-tailed t-test was applied for each individual comparison (*p < 0.05; ***p < 0.001, ****p < 0.0001, n.s no significance).

The increase of apoptotic activity in wdr5−/− mutant is largely dependent on the activation of p53.

a Graphs showing H3K4me3 and RNA peaks at p53 locus in WT and wdr5−/− mutant embryos at 3 dpf. b The confirmation of the expression levels of full-length p53 transcript (Exon 1-4, only in full-length p53) and Δ113p53 transcript (Exon 5–12 in both full-length p53 and Δ113p53) by qRT-PCR. c Western blots detected by anti-p53 (for both p53 50 kD and Δ113p53 35kD), anti-Wdr5, or anti-β-Actin antibody in WT and wdr5/− mutant embryos at 3 dpf. d Cryosections of WT, wdr5−/− and p53−/−;wdr5−/ embryos at 3 dpf were analyzed by TUNEL assay (in red). The nuclear was stained with DAPI (in blue). Statistical analysis on the percentages of apoptotic cells in the liver, pancreas or intestine between genotypes was showed in the right panel. L: liver; P: exocrine pancreas; I: intestine. e Cryosections of WT, wdr5−/− and p53−/−;wdr5−/− embryos at 3 dpf were immunostained by anti-Bhmt (in green). The nuclear was stained with DAPI (in blue). Framed area was magnified in bottom panel. Scale bar: 40 μm. Total cell number of liver was counted from the Bhmt-positive cells in continuous cryosections. Statistical analysis on the total cell numbers of liver between genotypes was showed in the right panel. f WISH of WT, wdr5−/− and p53−/−;wdr5−/− embryos at 3 dpf with foxa3. g WISH of WT, wdr5−/ and p53−/−;wdr5−/− embryos at 3 dpf with ebp, mgst3a, tkfc, apom and anxa4 as indicated. Each experiment was repeated for three times with similar results and a representative was showed here. n indicates the number of zebrafish embryos in each group. Data are mean ± S.D. Two-tailed t-test was applied for each individual comparison (**p < 0.01; ***p < 0.001, ****p < 0.0001; n.s no significance).

Wdr5-mediated H3K4me3 promotes differentiated cell survival partially by upregulating the expression of xiap-like gene

a Graphs showing H3K4me3 and RNA peaks at 5 anti-apoptotic gene loci (zgc:171740, chm, ptmab, crx and selenow2a) in WT and wdr5/− mutant embryos at 3 dpf. Both H3K4me3 and RNA peaks at these 5 gene loci were decreased in wdr5−/− mutant embryos. b Amino acid sequence alignment between zebrafish Zgc:171740 (Danio rerio NP_001103196), human XIAP (Homo sapiens NP_001158) and Xiap (Mus musculus NP_001288568). c WISH of zgc:171740 in WT and wdr5−/− embryos at 3 dpf. d Diagram showing the gRNA targeting site and 10-bp insertion (in red) in the exon 3 of zgc:171740 mutant, which results in a premature stop codon (PTC) at 79 aa. ATG: translation start codon. e Western blots of p53, Wdr5 and β-Actin in WT and zgc:171740/− mutant embryos at 3 dpf. f, g Cryosections of WT and zgc:171740−/− mutant embryos at 7 dpf were analyzed by TUNEL assay (in red) and the nuclear was stained with DAPI (in blue) (f). Framed area was magnified in bottom panel. I: intestine. Scale bar: 40 μm. Statistical analysis on the percentages of apoptotic cells in the intestine between WT and zgc:171740−/− mutant was in (g). h Model of the functions of Wdr5 in digestive organogenesis. Each experiment was repeated for three times with similar results and a representative was showed here. n indicates the number of zebrafish embryos in each group. Data are mean±S.D. Two-tailed t-test was applied for each individual comparison (***p < 0.001; n.s no significance).

Acknowledgments
This image is the copyrighted work of the attributed author or publisher, and ZFIN has permission only to display this image to its users. Additional permissions should be obtained from the applicable author or publisher of the image. Full text @ Cell Death Discov