- Title
-
Pleiotropic effects of a high confidence Autism Spectrum Disorder gene, arid1b, on zebrafish sleep
- Authors
- Doldur-Balli, F., Zimmerman, A.J., Keenan, B.T., Shetty, Z.Y., Grant, S.F.A., Seiler, C., Veatch, O.J., Pack, A.I.
- Source
- Full text @ Neurobiol Sleep Circadian Rhythms
|
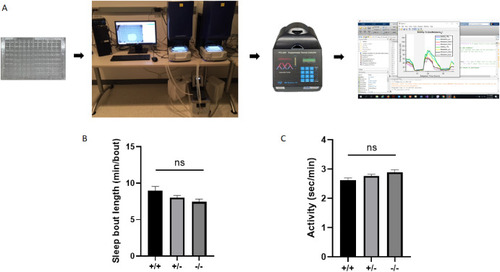
arid1b mutants showed a trend toward inability to maintain sleep bouts at night time and increased activity in daytime. A. Schematic displaying the work flow in zebrafish sleep assays. Zebrafish larvae collected from an in-cross of heterozygous arid1b pairs were individually pipetted into each well of a 96 well plate. A video monitoring system and a temperature control unit are employed to run the sleep assays. DNA was extracted and genotyping was performed immediately after sleep assay was completed. Analysis was carried out to match the genotype data with the phenotype data. B. Comparison of sleep bout length in arid1b zebrafish line using data collected in dark period. There is a trend toward decreased sleep bout length in night time sleep in arid1b mutants. C. Comparison of activity in arid1b zebrafish line using data collected in light period. There is a trend toward hyperactivity in arid1b mutants during day. Data in graphs B and C are presented as mean + 95% CI for group averages. Total n = 432, arid1b +/+ n = 118, arid1b ± n = 219, arid1b −/− n = 95. ns. Nonsignificant after Hochberg correction. |
|
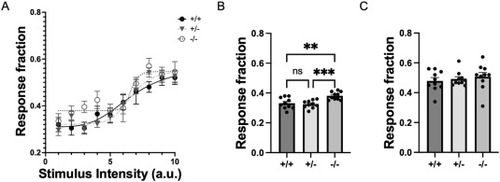
arid1b−/− larvae are hyper-responsive to low stimulus intensities during the night. A. Stimulus-response curves for arid1b+/+, +/−, and −/− larvae from arousal threshold assay. B. arid1b−/− larvae show significantly increased (F(2,27) = 10.10, p = 0.0005, by one-way ANOVA) responsiveness to lower intensity stimuli (<5 a.u.) compared to arid1b+/+ (p = 0.0031, by Tukey’s multiple comparisons test) and +/− (p = 0.0010, by Tukey’s multiple comparisons test). C. No significant differences were observed among groups at higher intensity stimuli (>5 a.u.). Asterisks indicate significance following p-value adjustment using Tukey’s multiple comparisons test. **p < 0.01, ***p < 0.001. Data are presented as mean ± 95% CI for group averages across each of 10 trials (n = 10 trials for 44 arid1b+/+, 94 arid1b +/−, and 45 arid1b −/− larvae). |
|
arid1b mutants display impaired social preference for the social cue. A. Image showing the experimental set-up to collect baseline and post-baseline social preference data. Dividers are taken out following habituation-I (5 min) and baseline (10 min) periods to perform habituation-II (5 min) and post-baseline (10 min) recordings. Data is captured from the virtually defined two rectangular zones on the middle well. B. Comparison of change in SPI across 3 genotypes. A significant difference in the time spent in interaction with the social cue, a zebrafish which is at the same age and size with the experimental animal, among arid1b genotypes (F(2, 81) = 5.40; p = 0.0063) was observed. **p < 0.01. C. Graphs showing SPI difference between baseline and post-baseline recordings in wild type, heterozygous and homozygous arid1b zebrafish. Heterozygous and homozygous animals spent less time in interaction with the social cue compared to the wild type controls. Data in graph B is presented as mean + 95% CI for group averages. Dots indicate individuals and red data represent mean ± 95% CI. Total n = 85, arid1b +/+ n = 20, arid1b ± n = 47, arid1b −/− n = 18. n: number of animals. (For interpretation of the references to colour in this figure legend, the reader is referred to the Web version of this article.) PHENOTYPE:
|


