
- Title
-
The circadian clock remains intact, but with dampened hormonal output in heart failure
- Authors
- Crnko, S., Printezi, M.I., Zwetsloot, P.M., Leiteris, L., Lumley, A.I., Zhang, L., Ernens, I., Jansen, T.P.J., Homsma, L., Feyen, D., van Faassen, M., du Pré, B.C., Gaillard, C.A.J.M., Kemperman, H., Oerlemans, M.I.F.J., Doevendans, P.A.F.M., May, A.M., Zuithoff, N.P.A., Sluijter, J.P.G., Devaux, Y., van Laake, L.W.
- Source
- Full text @ EBioMedicine
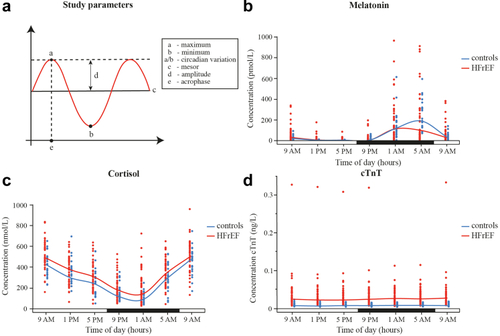
24-hour hormonal output is intact in HFrEF patients. (a) Parameters used for quantitative analysis of the 24-h melatonin and cortisol variation. 24-hour (b) melatonin (pmol/L), (c) cortisol (nmol/L) and (d) cTnT (ng/L) concentration. Each dot (red = patients, blue = controls) represents individual concentration at a given time-point. Lines indicate median values of all patients (red; N = 44–46) and controls (blue; N = 23–24). Horizontal bar indicates day (=white) and night (=black). cTnT = cardiac troponin T; HFrEF = heart failure with reduced ejection fraction. |
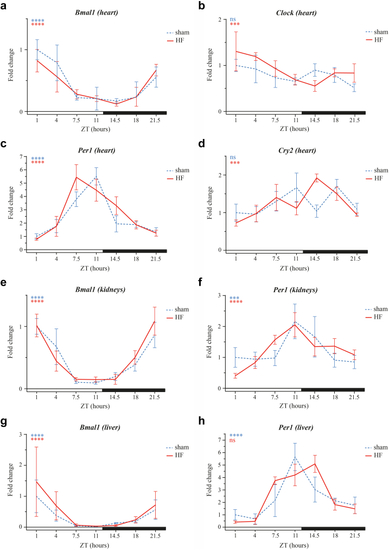
24-hour expression of core clock genes in murine organs. 24-hour (a) Bmal1, (b) Clock, (c) Per1, and (d) Cry2 expression levels in murine heart, and (e, g) Bmal1 and (f, h) Per1 in (e, f) kidneys and (g, h) liver between sham and HF group (N = 3–5 mice/group/ZT; mean ± SEM), normalised against sham ZT1. Statistical significance of cosinor rhythmicity of delta Ct values per group is indicated at the top left graph corner: ∗∗∗P < 0.001, ∗∗∗∗P < 0.0001. Horizontal bar indicates lights-on (=white; ZT0) and lights-off (=black; ZT12) period. Bmal1 = Brain and Muscle ARNT-Like 1; Clock = Circadian Locomotor Output Cycles Kaput; Cry2 = Cryptochrome Circadian Regulator 2; HF = heart failure; Per1 = Period Circadian Regulator 1; ZT = zeitgeber time. |
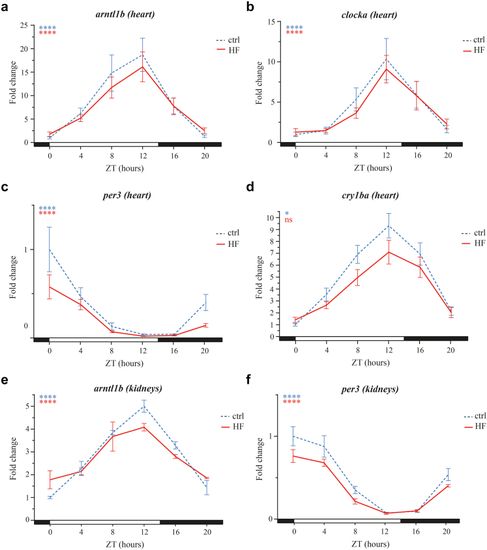
24-hour expression profiles of core clock genes in zebrafish organs. 24-hour (a) arntl1b, (b) clocka, (c) per3, and (d) cry1ba expression levels in zebrafish heart, and (e) arntl1b and (f) per3 in kidneys between control and HF ((a–d) N = 9, (e) N = 3, (f) N = 6 zebrafish/group/ZT; mean ± SEM), normalised against control ZT0. Statistical significance of cosinor rhythmicity of delta Ct values per group is indicated at the top left graph corner: ∗P < 0.05, ∗∗∗∗P < 0.0001. Horizontal bar indicates lights-on (=white; ZT0) and lights-off (=black; ZT14) period. arntl1b = Aryl Hydrocarbon Receptor Nuclear Translocator Like 1 b. Other abbreviations as in Fig. 2. |