
- Title
-
Embryonic ethanol exposure disrupts craniofacial neuromuscular integration in zebrafish larvae
- Authors
- Ghosal, R., Borrego-Soto, G., Eberhart, J.K.
- Source
- Full text @ Front. Physiol.
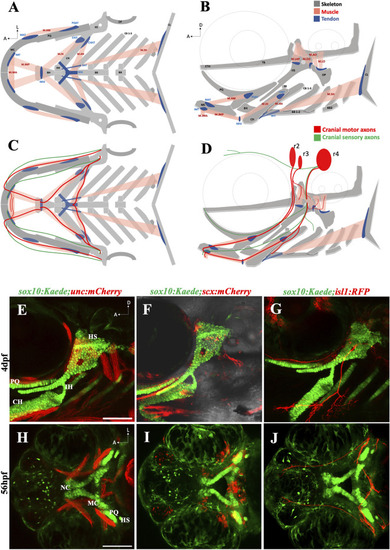
The zebrafish head has a complex anatomical organization (A, B) Schematics showing arrangement of craniofacial skeleton, muscle, and tendon in ventral and lateral planes (adapted from Schilling and Kimmel, 1997). (C, D) Schematics showing cranial nerves originating from rhombomere (r) 2, 3 & 4 innervating the branchial muscles in ventral and lateral planes. (E) 4dpf sox10:Kaede;unc:mCherry double transgenic fish showing musculoskeletal arrangement laterally. (F) 4dpf sox10:Kaede;scx:mCherry double transgenic fish showing tendons and cartilage laterally. (G) 4dpf sox10:Kaede;isl1:RFP double transgenic fish showing branchiomotor neurons and cartilage laterally. (H–J) Ventral view of developing zebrafish head at 56hpf showing craniofacial cartilage, muscle, tendons, and motor neurons emerge and integrate around the same developmental window. A (anterior), D (dorsal) L (lateral). r (rhombomere). Skeleton (grey)—BB (basibranchial), BH (basihyal), CB (ceratobranchial), CH (ceratohyal), CL (cleithrum), ETH (ethmoid), TB (trabecula), HH (hypohyal), HS (hyosymplectic), MC (Meckel’s cartilage), OP (opercle), PQ (palatoquadrate). Tendon (blue)—CHHT (ceratohyal hyohyoideus tendon), CHIT (ceratohyal interhyoideus tendon), HHJ (hyohyal junction), IMT (intermandibular tendon), MAT (Meckel’s adductor tendon), MHJ (mylohyoid junction), PQAT (palatoquadrate adductor tendon), SHT (sternohyoideus tendon). Muscle (pink)—M.AM (adductor mandibularis muscle), M. AO (adductor operculi muscle), M. DO (dilator operculi muscle), M. HH (hyohyoideus muscle), M. IH (interhyoideus muscle), M. IMA (Intermandibularis anterior muscle), M. IMP (Intermandibularis posterior muscle), M. LAP (levator arcus palatini muscle), M. LO (levator operculi muscle), M. SH (sternohyoideus muscle). Scale bar = 100 um. |
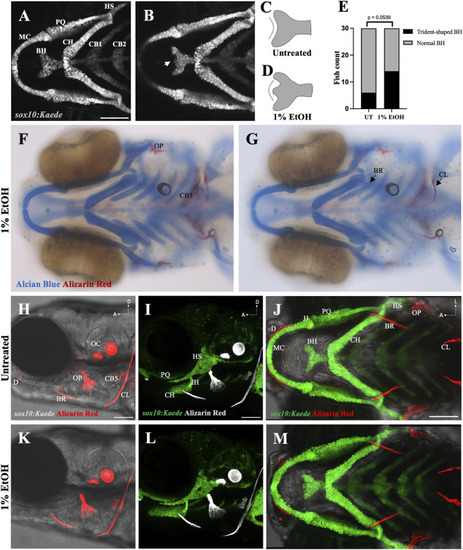
Ethanol can have mild effects on the shape of the basihyal cartilage (A) Ventral view of branchial cartilages in untreated (UT) sox10:Kaede fish at 4dpf. (B) Ventral view of branchial cartilages in ethanol (EtOH)-exposed sox10:Kaede fish at 4dpf showing trident-shaped basihyal (indicated by an arrow). (C, D) Schematics showing basihyal shape in untreated (C) and ethanol-exposed fish (D). (E) Number of fish with trident-shaped basihyal increase in the ethanol-exposed group. (F, G) Alcian and alizarin-stained, ethanol-exposed viscerocranium showing normal ossification at 4dpf in AB fish. (H–J) Live alizarin-stained untreated sox10:Kaede fish at 4dpf. (K–M) Live alizarin-stained sox10:Kaede, ethanol-exposed fish at 4dpf showing no ossification defects. BR (branchiostegal ray), CB5 (ceratobranchial 5), CL (cleithrum), D (dentary), JJ (jaw joint), OC (otic capsule), OP (opercle). Scale bar = 100 um. |

Ethanol induces ectopic muscle fibers (A) Ventral view of branchial skeleton and muscle in untreated sox10:Kaede;unc:mCherry fish at 4dpf. (D–F) Ethanol-exposed |

Ethanol can mislocate myotendinous attachment tissues (A, D) Ventral view of branchial cartilage and tendon in untreated sox10:Kaede;scx:mCherry fish at 4dpf. Arrows show the normal position of the MHJ (mylohyoid junction) around the anterior basihyal. (B,C, E) Posteriorized MHJ position in ethanol-exposed sox10:Kaede;scx:mCherry fish at the level of SHT (sternohyoideus tendon) in (B, E) and at the anterior end of ceratohyal in (C) (F) Ethanol-exposed sox10:Kaede;scx:mCherry fish immunostained with MF20 (gray), anti-Kaede (green) and anti-mCherry (red) antibodies. Arrow shows that the posterior end of the Intermandibularis posterior muscle (M.IMP) aligns with the MHJ tendon and is located at the level of ceratohyal. (G) Schematic showing posteriorized MHJ tendon and Intermandibularis posterior muscle (M.IMP). Arrow indicates the normal position of the MHJ tendon. |
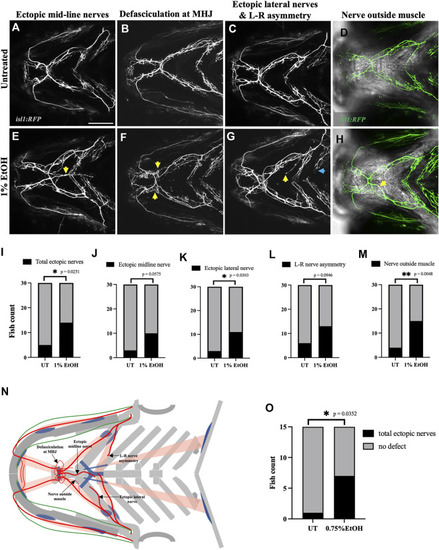
Ethanol induces cranial nerve defects (A–D) Untreated isl1:RFP fish showing motor innervation in the ventral branchial muscles at 4dpf. (E–H) Ethanol-exposed isl1:RFP fish showing various motor innervation defects. (E) Arrow shows ectopic nerves along the medial axis. (F) Arrows show defasciculation at mylohyoid junction (MHJ). (G) Yellow arrow shows ectopic nerve along the lateral axis. Blue arrow shows asymmetrical extension of nerves innervating the left and right side of the hyohyoideus muscle. (H) Maximum intensity Z-projected image with motor nerves (in green) merged with a single Z-plane of brightfield channel showing boundary of the interhyoideus muscle. Arrow indicates motor axons located outside the muscle boundary. (I–M) Number of fish with various cranial nerve defects in untreated and ethanol-exposed groups (n = 30 in each group). Number of fish with total ectopic nerves, ectopic lateral nerves and nerves outside the muscle boundary significantly increase in the ethanol-exposed group in I, K, M. (N) Schematic showing different cranial nerve defects found in the ethanol-exposed fish. (O) Number of fish with total ectopic cranial nerves significantly increase in 0.75% ethanol-exposed isl1:RFP fish (n = 15 in each group). * = p < 0.05; ** = p < 0.01. Scale bar = 100 um. |

Prevalence of ectopic cranial nerve defects increases in a dose-dependent manner (A–D) Representative images of most severe cranial nerve defects in isl1:RFP fish exposed to 0.25%, 0.5%, 0.75% % 1% ethanol between 6hpf-4dpf (n = 15 in each group). Arrows indicate ectopic nerves. (E–H) Representative images of fish with mild cranial nerve defects in 0.25%, 0.5%, 0.75% % 1% ethanol-exposed groups. (I–M) Chi-square test for trend shows a linear trend between the number of fish with cranial nerve defects and the concentration of ethanol. * = p < 0.05; ** = p < 0.01; *** = p < 0.001. Scale bar = 100 um. |

Ethanol induces cranial nerve defasciculation (A, B) Untreated and ethanol-exposed sox10:Kaede;isl1:RFP fish. Scale bar = 100 um. (C, D) Magnified view of motor innervations in Intermandibularis anterior (M.IMA), Intermandibularis posterior (M.IMP) and Interhyoideus muscles (M.IH) in untreated and ethanol-exposed fish. Scale bar = 50 um. Arrow in D indicates defasciculated exons around MHJ (mylohyoid junction). (E, F) High-resolution images of MHJ region in untreated and ethanol-exposed fish. (G) Number of fascicles at MHJ significantly increase in fish exposed to 1% ethanol.* = p < 0.05; *** = p < 0.001; **** = p < 0.0001. |

Ethanol does not affect early cranial nerve routing and pathfinding (A, B) Trigeminal nerve (n.V) and facial nerve (n.VII) extending towards BA (branchial arch)1 and BA2 in untreated sox10:Kaede;isl1:RFP embryo at 24hpf. (E, F) Normal extension of n. V and n. VII in ethanol-exposed sox10:Kaede;isl1:RFP embryos at 24hpf. (C, G) Untreated and ethanol-exposed sox10:Kaede;isl1:RFP fish at 48hpf. (D, H) Untreated and ethanol-exposed isl1:RFP fish at 72hpf. Arrow in H shows an extending ectopic nerve along the midline in ethanol-exposed fish. Scale bar = 100 um. |

Ethanol-induced nerve defects occur at the time of muscle innervation (A–E) 1% ethanol exposure between 6hpf-24hpf, 24hpf-48hpf, 24hpf-4dpf, 48hpf-4dpf and 72hpf-4dpf result in ectopic nerve defects. Arrows indicate ectopic nerves along the medial axis. (F–J) Number of ethanol-exposed isl1:RFP fish with total ectopic nerves, ectopic midline nerves, ectopic lateral nerves, nerve positioned outside the muscle, left-right nerve asymmetry (n = 15 in each group). The frequency of various nerve defects significantly increased in fish exposed to ethanol between 24 h-4 d and 48 h-4 d. (F, G) The frequency of ectopic nerve defects particularly increased in fish exposed to ethanol between 48 h and 4 d. (h/hpf-hours post fertilization, d-days post fertilization). * = p < 0.05; ** = p < 0.01; *** = p < 0.001. Scale bar = 100 um. |

Ectopic nerve defects are independent of ectopic muscle defects (A) Untreated isl1:GFP;unc:mCherry showing muscles in red and motor nerves in green. (B) Ethanol-exposed isl1:RFP fish immunolabeled with anti-RFP (in green) and MF20 (in red). Arrow indicates ectopic nerve without ectopic muscle. (C) Ethanol-exposed isl1:GFP;unc:mCherry fish with ectopic muscle fibers without motor innervation. Arrows indicate ectopic muscle fibers. (D) Ethanol-exposed isl1:GFP;unc:mCherry fish with coexisting ectopic nerve and ectopic muscle indicated by the arrow. Scale bar = 100 um. |

Number of postsynaptic receptors are reduced in ethanol-exposed fish (A–F) Immunostained neuromuscular junctions (NMJs) composed of presynaptic terminals (labeled with SV2) and postsynaptic acetylcholine receptors (labeled with α-BTX) in untreated (A–C) and ethanol-exposed (D–F)isl1:RFP fish. A and D are merged images with motor neurons (in blue), SV2 (in green) and α-BTX (in magenta). (G–R) Quantification of presynaptic and postsynaptic terminals in untreated (G–L) and ethanol-exposed (M–R) fish. NMJs were counted for Intermandibularis anterior, Intermandibularis posterior and Interhyal muscles by selecting an area of 300x180 um^2 as shown in G, J, M and P. H, K, N and Q show total number of particles after segmentation. I, L, O and R show particles with sizes greater than 8-micron square. (S) Number of α-BTX labeled particles >8 um^2 significantly reduced in ethanol-exposed fish. There was no significant change in the number of SV2 labeled particles. * = p < 0.05; ** = p < 0.01. Scale bar = 100 um. |