
- Title
-
DExH/D RNA helicase 15 regulates zebrafish intestinal development through the Wnt signaling pathway
- Authors
- Yao, J., Cai, Y., Chen, Z., Wang, X., Lai, X., Pan, L., Li, Y., Wang, S.
- Source
- Full text @ Genomics
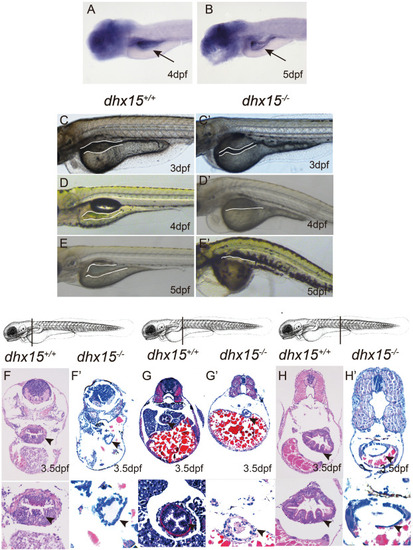
Fig. 1. Dhx15 knockout exhibits early intestinal structure abnormalities in zebrafish. (A-B) WISH analysis of RNA probe dhx15 in zebrafish at 4 dpf (A) and 5 dpf (B). The data showed dhx15 expressed in the intestine of zebrafish at 4 dpf and 5 dpf. (C-E C′-E') Lateral view of zebrafish embryos. Bright field images of dhx15+/+ and dhx15−/− zebrafish under microscope (Leica M50, ×10). The foregut enlargement of dhx15−/− embryos was not obvious compared with that in the widetype (the white line). (F-H F′-H′) H & E staining of the sagittal section from dhx15+/+ and dhx15−/− zebrafish at 3.5 dpf. The figures showed that the intestinal epithelium of dhx15−/− zebrafish (F′-H′ × 20, × 63) embryos was lacked folds, and had thin walls compared with the widetype (F H × 20, × 63). The position of the section was shown above the H & E staining images. The arrow and white line indicate the intestine of zebrafish. The arrow heads indicate the epithelium of the intestine. PHENOTYPE:
|
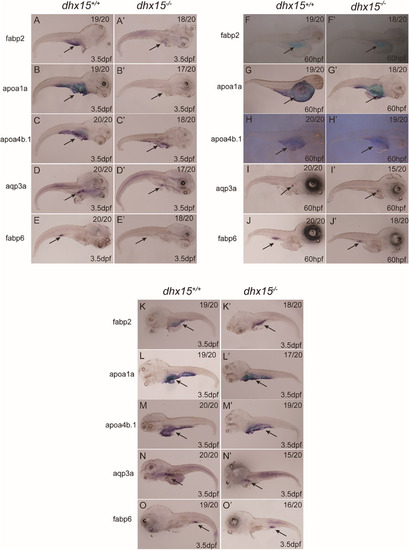
Fig. 2. Dhx15 is essential for zebrafish intestinal development. (A-E A'-E') WISH analysis of fabp2 (A A'), apoa1a (B B′), apoa4b.1 (C C′), aqp3a (D D′), fabp6 (E E') expression in zebrafish embryos at 3.5 dpf. The expression of fabp2 (expressed in small intestinal epithelial cells), apoa1a, apoa4b.1 (expressed in the gut), aqp3a (expressed in the gastrointestinal tract), and fabp6 (expressed in midgut) were dramatically deceased in dhx15 knockout compared with the wide-type zebrafish. (F-J F′-J') WISH analysis of fabp2 (F F′), apoa1a (G G'), apoa4b.1 (H H′), aqp3a (I I′), fabp6 (J J') expression in zebrafish embryos at 60 hpf. The expression of fabp2, apoa4a, apoa4b.1, aqp3a, and fabp6 were marginal decreased in dhx15 knockout compared with the wide-type zebrafish. (K-O K′-O′) WISH analysis of fabp2, apoa4a, apoa4b.1, aqp3a, fabp6 expression in zebrafish at 3.5 dpf. The expression of fabp2, apoa4a, apoa4b.1, aqp3a, and fabp6 in dhx15−/−;Tg (hsp70:DHX15-2A-mcherry) zebrafish were restored (K′-O′) after overexpressing DHX15 by conditional heat activation. The arrows indicate the intestine of zebrafish. EXPRESSION / LABELING:
PHENOTYPE:
|
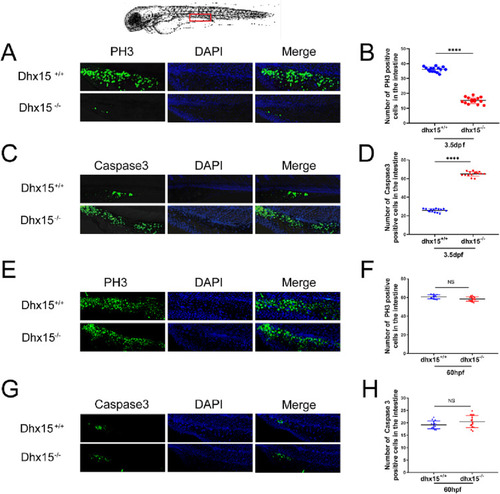
Fig. 3. Increased apoptosis and decreased proliferation were observed in dhx15 knockout zebrafish. (A) Representative images of PH3 immunofluorescence staining in dhx15+/+ and dhx15−/− zebrafish at 3.5 dpf. (B) The number of PH3-positive cells in the intestine of dhx15+/+ was significantly higher than that of dhx15−/− embryos at 3.5 dpf (P < 0.0001 by student t-test). (C) Representative images of Caspase3 immunofluorescence staining in dhx15+/+ and dhx15−/− zebrafish at 3.5 dpf. (D) The number of Caspase3 positive cells in the intestine of dhx15+/+ was significantly lower than that of dhx15−/− embryos at 3.5 dpf (P < 0.0001 by student t-test). (E) Representative images of PH3 immunofluorescence staining in dhx15+/+ and dhx15−/− zebrafish at 60 hpf. (F) The number of PH3-positive cells in the intestine of dhx15+/+ was comparable to that of dhx15−/− embryos at 60hpf (by student t-test). (C) Representative images of Caspase3 immunofluorescence staining in dhx15+/+ and dhx15−/− zebrafish at 60 hpf. (D) The number of Caspase3 positive cells in the intestine of dhx15+/+ was comparable to that of dhx15−/− embryos at 60 hpf (by student t-test). The red box outlined the location of immunofluorescence staining in the embryos. ****P < 0.0001, NS: not significant. (For interpretation of the references to colour in this figure legend, the reader is referred to the web version of this article.) PHENOTYPE:
|
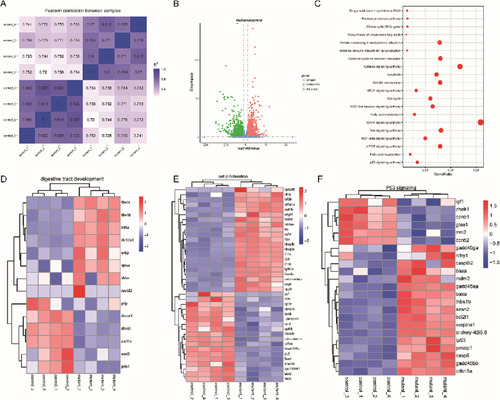
Fig. 4. RNA-seq genome wide analysis of dhx15+/+ and dhx15−/− zebrafish at 3.5 dpf. (A) The heat map of Pearson correlation analysis of two parallel experiments. The closer the correlation coefficient gets to 1, the better the repeatability between two parallel experiments it represents (B) Bioinformatics analysis of DEGs between dhx15+/+ and dhx15−/− zebrafish at 3.5 dpf. The red and green dots represent genes that are significantly up-regulated and down-regulated in the dhx15−/− embryos respectively. (C) GO analysis showed DEGs between dhx15+/+ and dhx15−/− zebrafish at 3.5 dpf. (D) Heat map analysis of the hierarchical clustering of DEGs in the development of the zebrafish digestive tract. (E) Heat map analysis of the hierarchical clustering of DEGs of in cell proliferation of in zebrafish. (F) Heat map analysis of the hierarchical clustering of DEGs of cell apoptosis of in zebrafish. DEGs: differentially expressed genes. (For interpretation of the references to colour in this figure legend, the reader is referred to the web version of this article.) |
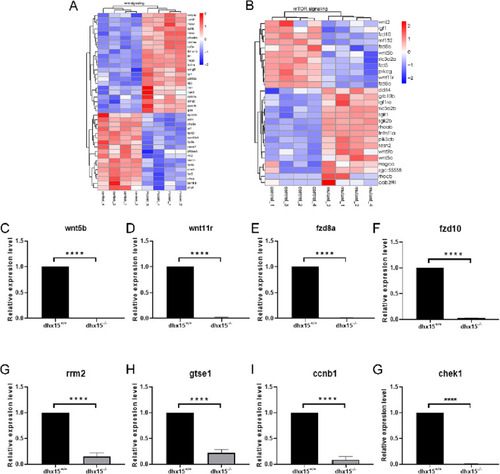
Fig. 5. Dhx15 may regulate intestinal development through the Wnt signal pathway. (A-B) Heat map analysis of the hierarchical clustering of DEGs in the Wnt signaling pathway (A) and the mTOR signaling pathway (B). (C-G) qRT-PCR analysis of wnt5b, wnt11r, fzd8a, fzd10, rrm2, gtse1, ccnb1, and chek1 in dhx15+/+ and dhx15−/− zebrafish at 3.5 dpf. Each qRT-PCR experiment was carried out in triplicates. qRT- PCR, quantitative real- time PCR. DEGs: differentially expressed genes. EXPRESSION / LABELING:
PHENOTYPE:
|