
- Title
-
Unraveling Presenilin 2 Functions in a Knockout Zebrafish Line to Shed Light into Alzheimer's Disease Pathogenesis
- Authors
- Barazzuol, L., Cieri, D., Facchinello, N., Calì, T., Washbourne, P., Argenton, F., Pizzo, P.
- Source
- Full text @ Cells
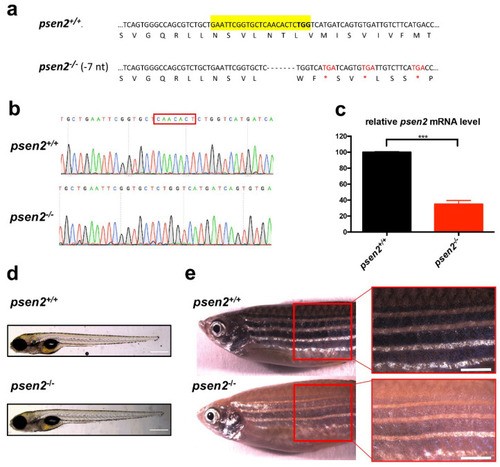
Knockout (KO) of psen2 gene. (a) Partial nucleotide and amino acid sequences of psen2 exon 4 showing a 7-bp deletion, confirmed by DNA sequencing. Deleted nucleotides are represented by dashes. CRISPR target site is highlighted in yellow and the protospacer-adjacent motif in bold. The 7-bp deletion results in a coding frameshift, with the insertion of premature stop codons (three in exon 4 marked in the figure as red asterisks, nine more in the following coding region). (b) Sequencing chromatographs of psen2+/+ and psen2−/− alleles. The red box delineates the area of the induced deletion. (c) RT-qPCR analysis on 1-year psen2+/+ and psen2−/− fish brain, showing a statistically significant decrease in psen2 mRNA level in psen2−/− mutants. Values represent the mean ± SEM. Data were generated from 3 biological replicates for each condition. Statistical significance was determined by two-tailed Student’s t-test (***, p < 0.001). (d) Representative images of psen2+/+ and psen2−/− 6-dpf larvae. Scale bar: 500 µm. (e) psen2+/+ and psen2−/− surface pigmentation at 6 months, showing an undetectable deposition of melanin in melanocytes of the psen2−/− mutant. Scale bar: 1 mm. |

Effect of Psen2 absence on Notch signaling and psen1 expression at early developmental stages. (a,b) Representative images and relative fluorescence quantification of psen2+/− incross progeny in Tg(EPV.Tpi–Mmu.Hbb: EGFP)ia12 transgenic background, both at (a) 3- and (b) 6-dpf. Genotyping was performed after image acquisition. Values represent the mean ± SEM. Data were generated from 3 independent experiments. R.I. = Relative Intensity. Scale bar: 500 µm. Statistical significance was determined by one-way ANOVA test. (c,d) Quantification of relative psen1 mRNA level in both (c) 3- and (d) 6-dpf psen2+/+ and psen2−/− larvae. Values represent the mean ± SEM. Data were generated from 3 biological replicates for each condition. Statistical significance was determined by two-tailed Student’s t-test. EXPRESSION / LABELING:
PHENOTYPE:
|
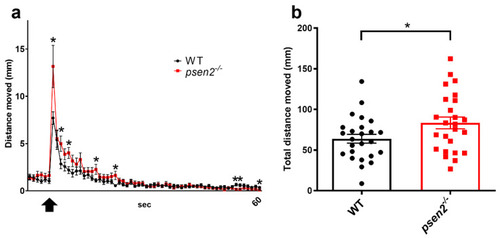
Effect of Psen2 absence on zebrafish larval behavior: vibrational startle analysis. (a) Plots of mean distance moved in response to a repetitive tapping stimulus in WT and psen2−/− larvae at 8-dpf. Black arrow indicates the beginning of tapping stimulation. (b) Quantification of the total distance moved by larvae during the entire experiment. Data were generated from 3 independent experiments. n = 25 larvae/condition. Values represent the mean ± SEM. Statistical significance was determined by two-tailed Student’s t-test (* = p < 0.05, ** = p < 0.01). PHENOTYPE:
|
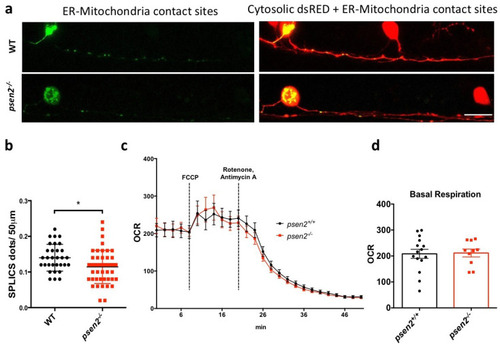
Effects of psen2 genetic manipulation on in vivo ER-mitochondria juxtaposition and mitochondrial respiration. (a) Representative images of the transient expression of the SPLICS probe for ER-mitochondria contact sites in RB neurons of 1-dpf WT and mutant embryos. (b) Relative quantification of GFP reconstituted dots in the first 50 µm of RB axons in all the conditions analyzed. Data was generated from 3 or more independent experiments/conditions. Statistical significance was determined by two-tailed Student’s t-test. (c) Mean oxygen consumption rate (OCR) in psen2+/+ and psen2−/− larvae at 4-dpf upon different treatments. Dashed bars indicate the addition of FCCP (0.5 µM) or Rotenone/Antimycin A (2 µM and 5 µM, respectively). Genotyping was performed after OCR measurements. WT: n = 15; psen2−/−: n = 10. Values represent mean ± SEM. (d) Quantification of basal OCR, as reported in (c). Statistical significance was determined by two-tailed Student’s t-test (* = p < 0.05). PHENOTYPE:
|
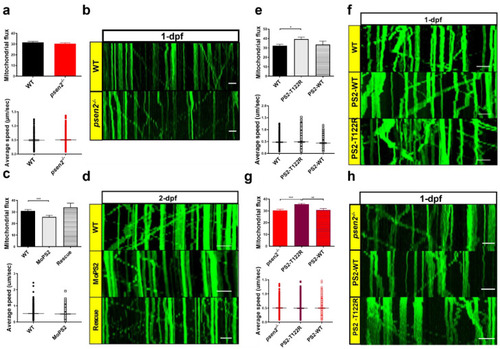
Effect of Psen2 genetic manipulation on mitochondrial axonal transport. (a) Mitochondrial flux (n of axons > 35/condition) and average speed (n of mitochondria > 200/condition) quantification in WT and psen2−/− 1-dpf zebrafish embryos. Data were generated from more than 5 independent experiments. (b) Representative kymographs showing mitochondrial movement in WT and psen2−/− 1-dpf embryos. Scale bar: 10 μm. (c) Mitochondrial flux (n of axons: WT, psen2 morphants (MoPS2) > 50; rescue = 14) and average speed (n of mitochondria > 500 /condition) quantification in WT, psen2 KD and psen2 KD + human WT PS2 (Rescue) 2-dpf fish. Data were generated from more than 5 independent experiments. (d) Representative kymographs showing mitochondrial movement in WT, psen2 morphants, and rescued fish at 2-dpf. Scale bar: 10 μm. (e) Mitochondrial flux (n of axons: WT = 44; + human PS2–T122R = 66; + human PS2–WT = 21) and mitochondrial average speed (n of mitochondria: WT = 320; + human PS2–T122R = 454; + human PS2–WT = 170) quantification in 1-dpf embryos, injected or not with human PS2 mRNA, WT or T122R. Statistical significance was determined by one–way ANOVA test (* = p < 0.05). Data were generated from more than 5 independent experiments. (f) Representative kymographs showing mitochondrial movement in 1-dpf WT fish, injected or not with mRNA of human PS2, WT or T122R, as indicated. Scale bar: 10 μm. (g) Mitochondrial flux (n of axons > 50/condition) and average speed (n of mitochondria > 300/condition) quantification in psen2−/− 1-dpf embryos injected or not with human PS2 mRNA, WT or T122R. Statistical significance was determined by one-way ANOVA test (* = p < 0.05, ** = p < 0.01, *** = p < 0.001). (h) Representative kymographs showing mitochondrial movement in 1-dpf psen2−/− fish, injected or not with human PS2 WT or T122R mRNA, as indicated. Scale bar: 10 μm. PHENOTYPE:
|

Effect of Psen2 absence on autophagy. (a,b) Representative blots and relative quantifications of LC3-II levels (normalized to tubulin levels) in WT and psen2−/− embryos or larvae at (a) 2- and (b) 8-dpf, respectively, in basal conditions or upon the induction of autophagy (by rapamycin, RAPA), in the presence or not of the lysosomal inhibitor bafilomycin (BAF). (a) Pools of 15 WT and psen2−/− embryos were treated with either vehicle (DMSO) or 1 µM Rapamycin (Rapa) from 8- to 48-hpf (to induce autophagy), with or without the addition of 40 nM Bafilomycin (Baf) at 32-hpf (final 16 h-treatment with the lysosomal inhibitor). Mean ± SEM, n = 3 independent experiments. (b) Pools of 10 6-dpf WT and psen2−/− larvae either fed (3 times per day) or starved for 2 days, treated or not with 40 nM BAF for the last 16 h of the experiment. Mean ± SEM, n = 3 independent experiments. (c) Representative blot and relative quantification of LC3-II levels (normalized to tubulin levels) in the brains of psen2+/+ and psen2−/− 6-month-old fish. Data were generated from 3 brains for each genotype. Values represent the mean ± SEM. * = p < 0.05; ** = p < 0.01; *** = p < 0.001. |