
|
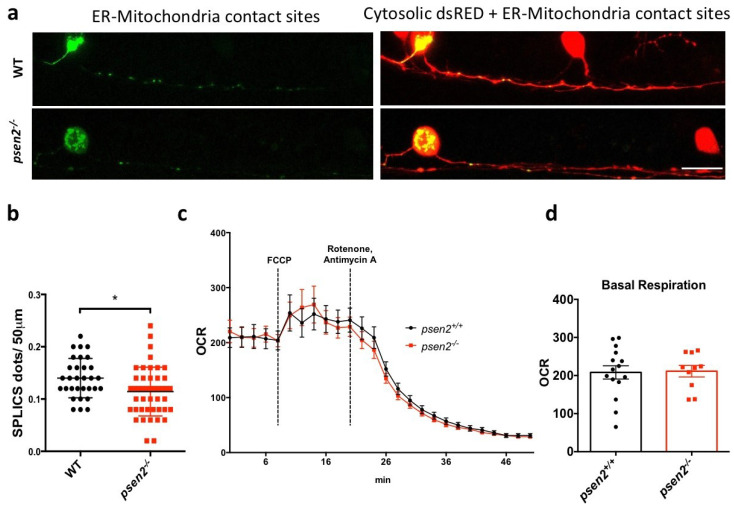
Figure 4
Effects of psen2 genetic manipulation on in vivo ER-mitochondria juxtaposition and mitochondrial respiration. (a) Representative images of the transient expression of the SPLICS probe for ER-mitochondria contact sites in RB neurons of 1-dpf WT and mutant embryos. (b) Relative quantification of GFP reconstituted dots in the first 50 µm of RB axons in all the conditions analyzed. Data was generated from 3 or more independent experiments/conditions. Statistical significance was determined by two-tailed Student’s t-test. (c) Mean oxygen consumption rate (OCR) in psen2+/+ and psen2−/− larvae at 4-dpf upon different treatments. Dashed bars indicate the addition of FCCP (0.5 µM) or Rotenone/Antimycin A (2 µM and 5 µM, respectively). Genotyping was performed after OCR measurements. WT: n = 15; psen2−/−: n = 10. Values represent mean ± SEM. (d) Quantification of basal OCR, as reported in (c). Statistical significance was determined by two-tailed Student’s t-test (* = p < 0.05).