
|
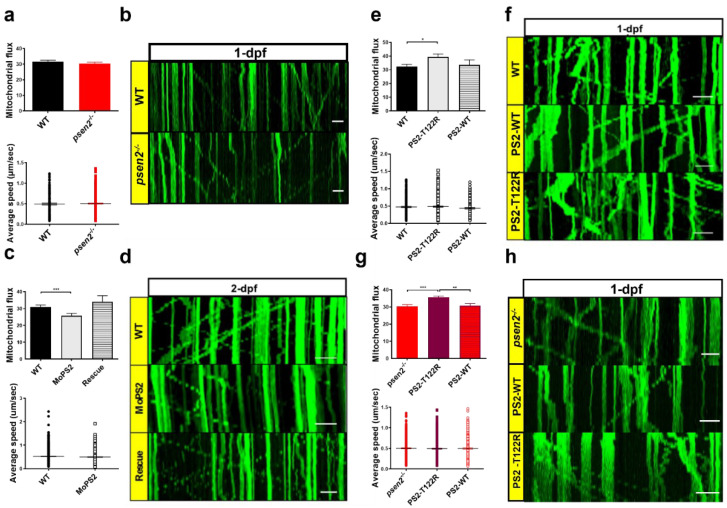
Figure 5
Effect of Psen2 genetic manipulation on mitochondrial axonal transport. (a) Mitochondrial flux (n of axons > 35/condition) and average speed (n of mitochondria > 200/condition) quantification in WT and psen2−/− 1-dpf zebrafish embryos. Data were generated from more than 5 independent experiments. (b) Representative kymographs showing mitochondrial movement in WT and psen2−/− 1-dpf embryos. Scale bar: 10 μm. (c) Mitochondrial flux (n of axons: WT, psen2 morphants (MoPS2) > 50; rescue = 14) and average speed (n of mitochondria > 500 /condition) quantification in WT, psen2 KD and psen2 KD + human WT PS2 (Rescue) 2-dpf fish. Data were generated from more than 5 independent experiments. (d) Representative kymographs showing mitochondrial movement in WT, psen2 morphants, and rescued fish at 2-dpf. Scale bar: 10 μm. (e) Mitochondrial flux (n of axons: WT = 44; + human PS2–T122R = 66; + human PS2–WT = 21) and mitochondrial average speed (n of mitochondria: WT = 320; + human PS2–T122R = 454; + human PS2–WT = 170) quantification in 1-dpf embryos, injected or not with human PS2 mRNA, WT or T122R. Statistical significance was determined by one–way ANOVA test (* = p < 0.05). Data were generated from more than 5 independent experiments. (f) Representative kymographs showing mitochondrial movement in 1-dpf WT fish, injected or not with mRNA of human PS2, WT or T122R, as indicated. Scale bar: 10 μm. (g) Mitochondrial flux (n of axons > 50/condition) and average speed (n of mitochondria > 300/condition) quantification in psen2−/− 1-dpf embryos injected or not with human PS2 mRNA, WT or T122R. Statistical significance was determined by one-way ANOVA test (* = p < 0.05, ** = p < 0.01, *** = p < 0.001). (h) Representative kymographs showing mitochondrial movement in 1-dpf psen2−/− fish, injected or not with human PS2 WT or T122R mRNA, as indicated. Scale bar: 10 μm.