FIGURE SUMMARY
Title

Variable phenotypes and penetrance between and within different zebrafish ciliary transition zone mutants

Authors
Wang, J., Thomas, H.R., Thompson, R.G., Waldrep, S.C., Fogerty, J., Song, P., Li, Z., Ma, Y., Santra, P., Hoover, J.D., Yeo, N.C., Drummond, I.A., Yoder, B.K., Amack, J.D., Perkins, B., Parant, J.M.
Source
Full text @ Dis. Model. Mech.

Gross phenotype of cilia-related mutants and wild-type (WT) zebrafish across time. Lateral views of WT and mutant animals at 2 days post fertilization (dpf), 5 dpf, 3 weeks post fertilization (wpf) and >3 months post fertilization (mpf; adult). The penetrance of the imaged phenotype [curled-down tail (CDT) and/or scoliosis for most, a decreased head-trunk-angled defect (HTA) for mks1 and b9d2, and small size for tmem216] in −/− animals is indicated in the bottom right of each panel (P, observed/total number of −/− identified). At 3 wpf and in adults, we indicate the Mendelian inheritance (MI) in the bottom left of each panel. MI was calculated as % of the number of observed −/− divided by the expected number of −/− (1/3 of the sum of observed +/+ and +/−). Scale bars: 1000 μm.

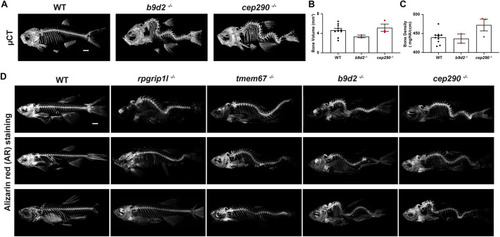
Scoliosis in transition zone (TZ) mutants. (A) Microcomputed tomography (μCT) images of lateral views of representative WT, and b9d2 and cep290 mutant zebrafish at 3 mpf. (B,C) The bone volume (B) and density (C) of WT, and b9d2 and cep290 mutant zebrafish. Each dot represents individual adults. WT, black dots; b9d2−/− and cep290−/−, red dots. WT (n=10), b9d2−/− (n=2) and cep290−/− (n=3). Error bars represent ±s.e.m. (D) Alizarin Red (AR)-stained lateral view images of representative WT, and rpgrip1l, tmem67, b9d2 and cep290 mutant zebrafish at 3 mpf. Scale bars: 1000 μm.

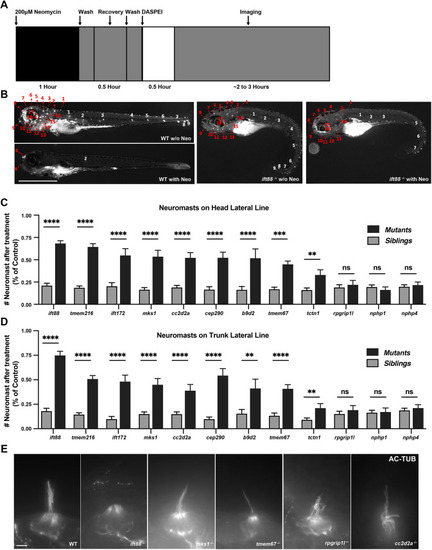
TZ mutants have variable resistance to neomycin treatment. (A) Diagram of timeline of neuromast staining. Zebrafish embryos at 5 dpf were exposed to 200 µM neomycin for 1 h, and neuromasts in the lateral line were stained with 2-[4-(dimethylamino) styryl]-N-ethylpyridinium iodide (DASPEI) and counted 2 h following initial neomycin exposure. (B) Representative images of neuromasts in the lateral line in WT and ift88−/− zebrafish embryos at 5 dpf stained with DASPEI with and without (w/o) 200 nM neomycin treatment. The positions of neuromasts are numbered; red numbers indicate neuromasts in the head, and white numbers indicate neuromasts in the trunk. Scale bar: 1000 μm. (C,D) Percentage of neuromasts after neomycin treatment in the head (C) and trunk (D) lateral line for mutants and their siblings (including WT and heterozygous). Error bars represent ±s.e.m. ns, not significant; **P<0.01, ***P<0.001 and ****P<0.0001. Unpaired two-tailed Student's t-test (n>20 for all mutants from two independent experiments). (E) Representative images of anti-acetylated Tubulin staining of mechanosensory hair cells in WT, and ift88, mks1, tmem67, rpgrip1l and cc2d2a mutant embryos at 2 dpf. Scale bar: 5 μm.

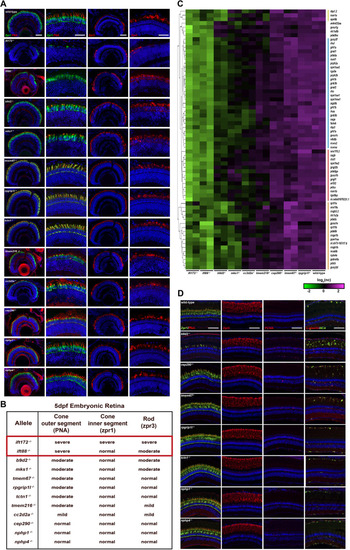
Immunohistochemical (IHC) and transcriptional analysis of rod and cone photoreceptors for embryonic and adult retina sections of WT and cilia-related mutants. (A) IHC staining of retinal cryosections of WT, and ift88, ift172, b9d2, mks1, tmem67, rpgrip1l, tctn1, tmem216, cc2d2a, cep290, nphp1 and nphp4 mutant embryos at 5 dpf. Dorsal views are shown. Images of IHC staining of cone photoreceptors with Zpr1 (green; inner segment), PNA (red; outer segment) and DAPI (blue; nuclei) in column 1. Higher-magnification images are in column 2. Images of IHC staining of rod photoreceptors with Zpr3 (red; rhodopsin – outer segment if trafficked properly) and nuclei with DAPI (blue) are in column 3. Higher-magnification images are in column 4. Scale bars: 50 µm (columns 1 and 3); 25 µm (columns 2 and 4). (B) The table depicting retinal defects observed in mutant embryos. ift172−/− and ift88−/− results are highlighted by a red box. (C) K-means clustering of log2 normalized counts of the 65 retinal genes. The experiment workflow for how we defined these 65 genes is shown in Fig. S9A. Colored sidebars represent different clustering groups (yellow, blue, red and orange). (D) Representative cryosectioned 3-month-old adult retinae of WT, and viable b9d2, cep290, tmem67, rpgrip1l, tctn1, nphp1 and nphp4 mutants stained with Zpr1/PNA (green/red; column 1), Zpr3 (red; column 2), Pcna (proliferating cells; red; column 3) and L-plastin/4C4 (green; pan-leukocyte marker/red; microglia marker; column 4). Scale bars: 100 µM.

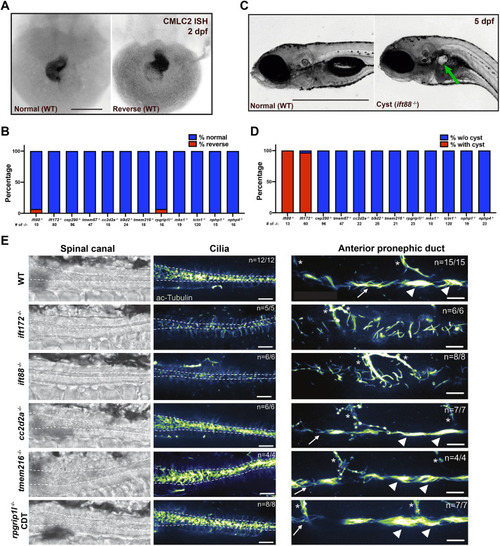
TZ mutants lack left–right heart looping or glomerular cyst, and have normal-appearing cilia. (A) Whole-mount in situ hybridization (ISH) against cmlc2 RNA in WT zebrafish embryos at 2 dpf with normal phenotype of heart looping (left) and reverse heart looping (right). Reverse example found in WT clutch. Scale bar: 25 μm. (B) Bar graph depicting the ratio of mutant embryos with normal heart looping (% normal, blue) and with reverse heart looping (% reverse, red) at 2 dpf. The total number of each mutant is indicated. (C) Gross images of lateral views of representative zebrafish embryos with cyst (right; imaging with ift88−/−) or without cysts (left; imaging with WT embryo). Green arrow indicates the pronephric cyst. Scale bar: 1000 μm. (D) Bar graph depicting the ratio of mutant embryos without cysts (% w/o cyst, blue) and with cysts (% with cyst, red) at 5 dpf. The total number of each mutant is indicated. (E) Immunostaining of cilia in spinal canal and anterior pronephric duct. Acetylated-Tubulin antibodies were used to detect cilia in the caudal end of the spinal canal near the tip of the tail and in the anterior pronephric duct at 2 dpf. Representative brightfield images of the spinal canal, and fluorescent images of the spinal canal and anterior pronephric duct (green fire blue LUT) are shown for WT, ift172/−, ift88−/−, cc2d2a−/−, tmem216−/− and rpgrip1l−/− embryos. WT siblings were analyzed for each mutant. All mutant embryos analyzed had a CDT phenotype. Dashed lines outline approximate boundaries of the spinal canal. The anterior pronephric duct has a mixture of multi-ciliated tufts (arrowheads) and monocilia (arrows). Motor axons are also stained by acetylated-Tubulin antibodies (marked with asterisks). n=number of embryos with the depicted staining/total number of embryos analyzed. Scale bars: 25 µm.

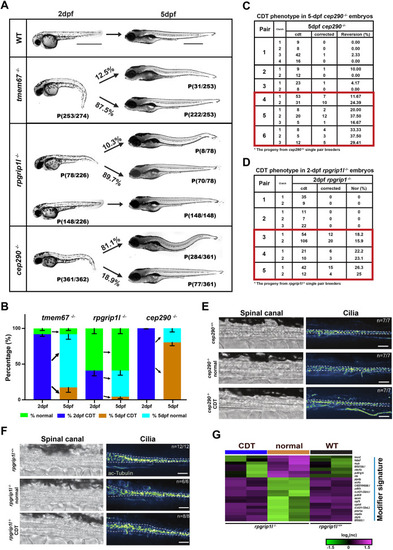
Variable penetrance of the CDT phenotype in tmem67, rpgrip1l and cep290 mutants. (A) Lateral views of WT and mutants at 2 dpf and 5 dpf. All homozygous mutant embryos were obtained from a single pair of heterozygous mutant crosses that were dechorionated at 1 dpf. Embryos were sorted for CDT at 2 dpf and then reanalyzed at 5 dpf. All embryos were genotyped after phenotype analysis at 5 dpf. Arrows denote the phenotypic changes across time. Percentage was calculated as the % of observed number of −/− at 5 dpf divided by the observed number of −/− at 2 dpf. Scale bars: 1000 μm. (B) Bar graph representing distribution of CDT phenotype at 2 dpf and 5 dpf. For tmem67−/−, n=274 from ten breeding pairs of tmem67+/− adults. For cep290−/−, n=351 from 23 breeding pairs of cep290+/− adults. For rpgrip1l−/−, n=226 from ten breeding pairs of rpgrip1l+/− adults. Arrows point to derivates of the 2 dpf phenotype. Error bars represent ±s.e.m. (C) Table depicting the revertant rate from repeatedly bred cep290+/− pairs. (D) Table depicting the ratio of embryos with normal-looking tail from repeatedly bred rpgrip1l−/− pairs. As above, embryos were dechorionated at 1 dpf, sorted at 2 dpf, reanalyzed at 5 dpf and genotyped after. Data are only for cep290−/− and rpgrip1l−/− embryos. Red boxes in C and D denote pairs that had repeatedly high reversion rates. (E) Comparison of spinal canal cilia in tails of cep290l−/− embryos with a CDT or reverted normal-looking tail at 5 dpf. Representative brightfield images of the spinal canal and fluorescent images of acetylated-Tubulin staining (green fire blue LUT) are shown for WT, cep290/− embryos with a normal-looking tail and cep290/− embryos with CDT. Dashed lines outline approximate boundaries of the spinal canal. Scale bars: 25 μm. (F) Comparison of spinal canal cilia in tails of rpgrip1l−/− embryos with CDT or normal-looking tail. Representative brightfield images of the spinal canal and fluorescent images of acetylated-Tubulin staining (green fire blue LUT) are shown for rpgrip1l+/+ and rpgrip1l−/− embryos with a normal-looking (straight) tail, and rpgrip1l−/− embryos with a CDT. Dashed lines outline approximate boundaries of the spinal canal. n=number of embryos with the depicted staining/total number of embryos analyzed. Scale bars: 25 μm. (G) K-means clustering of log2 normalized counts define modifier signature cluster among the top 100 DEGs in 2 dpf rpgrip1l−/− with CDT, rpgrip1l−/− with normal-looking tail (normal) and rpgrip1l+/+ groups (WT).

PHENOTYPE:
Fish:
Observed In:
Stage Range: Long-pec to Day 5

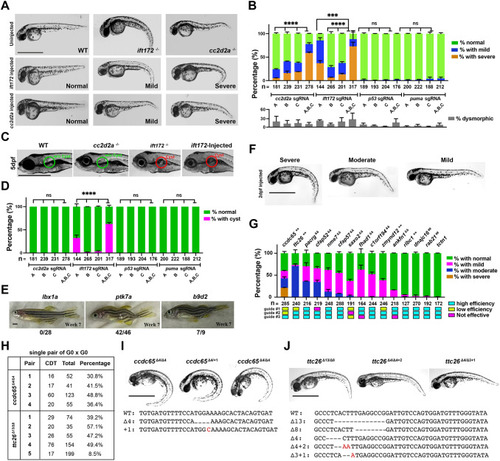
Recapitulation of null phenotypes in G0 embryos by three-guide targeting of ift172 and cc2d2a. (A) Lateral view images of 2 dpf zygotic WT, cc2d2a−/− and ift172−/− embryos, as well as representative images of observed cc2d2a and ift172 CRISPR G0 ‘normal’, ‘mild’ and ‘severe’ CDT embryos in each group. (B) Quantification of CDT phenotypes at 2 dpf after injections of single- or three-guide Cas9 RNPs against cc2d2a, ift172, p53 and puma. Embryos were first sorted for dysmorphic phenotypes (gray, lower panel) at 1 dpf. Non-dysmorphic embryos were then scored and counted at 2 dpf for the degree of CDT phenotype as defined in A. The percentage with normal tail (green), or mild (blue) or severe (orange) CDT is indicated. ns, not significant; ***P<0.001, ****P<0.0001. Fisher's exact test for severe versus other phenotype. The n numbers in each group shown are from at least two independent experiments. Error bars represent ±s.e.m. (C) Representative lateral views of 5 dpf zygotic WT, cc2d2a−/− and ift172−/−, and an example of an injected embryo at 5 dpf with pronephric cyst. (D) Quantification of cysts at 5 dpf after injections of single- or three-guide Cas9 RNPs against cc2d2a, ift172, p53, puma and tctn1. The percentage with (pink) or without (green) pronephric cyst formation is indicated. ns, not significant; ****P<0.0001. Fisher's exact test for cysts versus no cysts. The n numbers in each group shown are from at least two independent experiments. Error bars represent ±s.e.m. (E) Representative images of the lateral view of WT adult zebrafish at 7 wpf injected with four lbx1a gRNAs as negative controls, four-guide Cas9 RNP targeting ptk7a as positive controls or b9d2. Numbers of observed over analyzed are noted. (F) Representative images of observed 2 dpf CRISPR-injected ‘severe’, ‘moderate’ and ‘mild’ G0 embryos for each gene of interest. (G) Quantification of CDT phenotypes at 2 dpf after injection of three-guide Cas9 RNPs against 15 novel cilia gene candidates and tctn1. The percentage with normal tail (green), and mild (magenta), moderate (blue) or severe (orange) CDT is indicated. The n numbers in each group shown are from at least two independent experiments. Error bars represent ±s.e.m. The gRNA efficiency was determined by high-resolution melting curve analysis and color-labeled with blue (high efficiency), yellow (low efficiency) and magenta (without efficiency). The source of these novel genes is indicated: **genes from CiliaCarta top 50 genes; &&genes from Patir et al. (2020); ##genes from Reiter proteomic analysis. (H) Table depicting the number of 2 dpf F1 embryos with different phenotypes from single-pair breedings of injected ccdc65 or ttc26 G0s. (I,J) Representative gross images of 2 dpf embryos with ccdc65 (I) and ttc26 (J) compound mutations. Mutations of the embryos with CDT from the two injected clutches were validated by Sanger sequencing. Sequencing results are listed comparing with WT. ‘–’ indicates the deletion. Nucleotides in red indicate the deletion. Scale bars: 1000 μm.

PHENOTYPE:
Fish:
Knockdown Reagents:
Observed In:
Stage Range: Long-pec to Adult

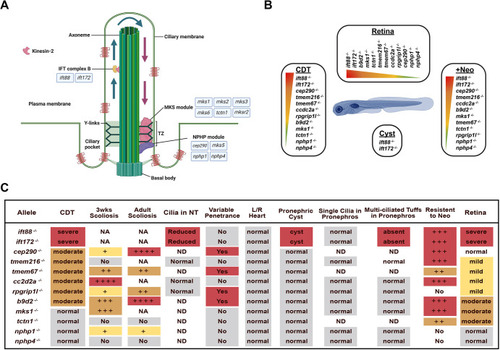
Summary of data indicating differential requirement for TZ genes. (A) Illustration of cilium, TZ and genetic components examined in this study. (B) Differential requirement for different TZ genes in different tissues based on phenotypic severity. (C) Table summarizing the variable phenotypes shown in each mutant: red, severe; orange, moderate; yellow, mild; gray, normal looking. Graphic image created with BioRender.com.

ZFIN is incorporating published figure images and captions as part of an ongoing project. Figures from some publications have not yet been curated, or are not available for display because of copyright restrictions.

EXPRESSION / LABELING:
Gene:
Antibody:
Fish:
Anatomical Term:
Stage: Long-pec
PHENOTYPE:
Fish:
Observed In:
Stage: Long-pec

Unillustrated author statements

Acknowledgments
This image is the copyrighted work of the attributed author or publisher, and ZFIN has permission only to display this image to its users. Additional permissions should be obtained from the applicable author or publisher of the image. Full text @ Dis. Model. Mech.