
- Title
-
Deletion of POMT2 in Zebrafish Causes Degeneration of Photoreceptors
- Authors
- Liu, Y., Rittershaus, J.M., Yu, M., Sager, R., Hu, H.
- Source
- Full text @ Int. J. Mol. Sci.
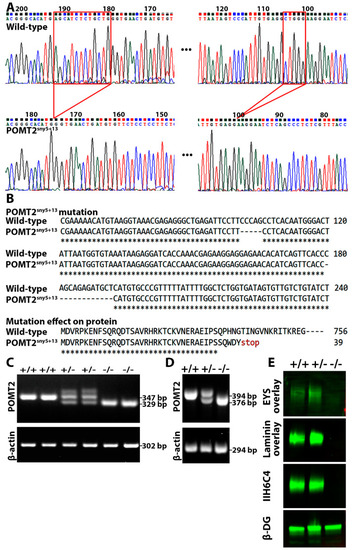
Deletion of pomt2 in zebrafish ablated matriglycan and caused loss of EYS binding. pomt2 mutant zebrafish were generated by CRISPR. Crossing of heterozygous mutant zebrafish generated homozygous mutant fish. Skeletal muscle lysates were used for IIH6C4 immunoblotting and EYS overlay assays. (A) Sequencing chromatogram of wild-type and pomt2sny5+13 PCR product. The two small deletions in exon 2 are bracketed with red marks. (B) Alignment of part of exon 2 sequences showing the two small deletions in the pomt2sny5+13 mutant and alignment of wild-type POMT2 protein with the expected truncated POMT2 peptides in the pomt2sny5+13 mutant. The mutant POMT2 protein has only 39 amino acid residues in total. (C) Example of PCR genotyping showing that wild-type zebrafish produce a 347 bp fragment while homozygous mutant animals produce a 329 bp fragment. (D) RT-PCR of wild-type animals produce only a 394 bp fragment, homozygous mutant animals produce a 376 bp fragment, and heterozygous animals produce both 394 and 376 bp fragments. (E) IIH6C4 and β-DG Western blotting and EYS and laminin overlay on pomt2sny5+13 mutant. Note abolished IIH6C4 reactivity and EYS and laminin binding in muscle lysate of homozygous pomt2 mutant. EXPRESSION / LABELING:
PHENOTYPE:
|
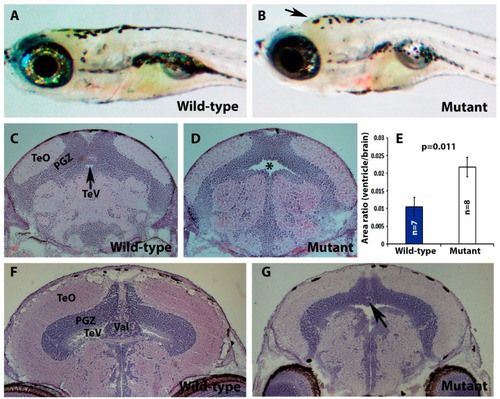
pomt2 mutant zebrafish exhibit hydrocephalus, hypoplasia of the cerebellum, and muscular dystrophy. Sections of the brain and skeletal muscle were stained with H&E. (A,B) Lateral view of a wild-type and a pomt2 mutant zebrafish both dead 3 weeks post fertilization. Note the domed head in the mutant (arrow). (C,D) H&E staining of the rostral region of the optic tectum in zebrafish at 2-mpf. Note pomt2 mutant zebrafish showing an enlarged tectal ventricle (asterisk in (D)). (E) Ratio of ventricular area to total brain cross-sectional area. Note the increased ratio in the mutant. (F,G) H&E staining of the caudal region of the optic tectum in zebrafish at 2-mpf. Homozygous pomt2sny5+13 mutant exhibited hypoplasia of the cerebellum (arrow). (H,I) H&E of skeletal muscle at 2-mpf. Note presence of dystrophic myofibers including necrotic fibers (asterisks), centrally located nuclei (arrowhead), and variably sized fibers. Scale bar in I: 50 µm for (C,D), 60 µm for (F,G), 28 µm for (H,I). Abbreviations: TeO = tectum opticum; PGZ = periventricular gray zone; TeV = tectal ventricle; Val = valvular cerebellum. PHENOTYPE:
|
|
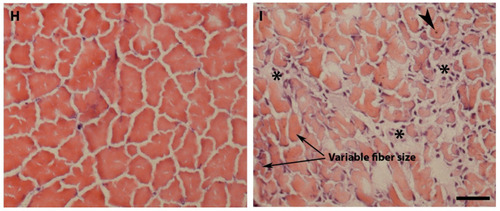
EYS protein was reduced and mis-localized in pomt2 mutant zebrafish retinas. Retinal sections from zebrafish at 1-mpf were double immunostained with EYS (green fluorescence) and acetylated α-tubulin (red fluorescence). The sections were counterstained with DAPI to show nuclei. (A,C) Wild-type retina at 1-mpf. Most EYS-positive puncta in the wild-type retina were associated with the basal end of acetylated α-tubulin reactivity (arrows). (B,D) pomt2sny5+13 homozygous mutant retina at 1-mpf. Overall, EYS immunoreactivity in the mutant was much lower than the wild-type. Most of the EYS-positive puncta were not associated with acetylated α-tubulin but were localized to the outer nuclear layer. (E) Counting of EYS-acetylated α-tubulin double staining from the outer nuclear layer to the retinal pigment epithelium (RPE) (n = 3). Note that acetylated α-tubulin reactivity associated with EYS puncta were decreased in the mutant, and acetylated α-tubulin not associated with EYS puncta were increased in the mutant. (F) Percentage of EYS associated with α-tubulin immunoreactivity and not associated with acetylated α-tubulin (n = 3). Note that EYS immunoreactivity associated with acetylated α-tubulin was reduced in pomt2 mutant retinas, but non-associated EYS puncta were increased in these animals. (G) Percentage of acetylated α-tubulin immunoreactivity associated and not associated with EYS (n = 3). Note that acetylated α-tubulin immunoreactivity associated with EYS was reduced but acetylated α-tubulin immunoreactivity not associated with EYS was increased in pomt2 mutant retinas. Scale bar in (D): 10.5 µm for (A,B); 5 µm for (C,D). EXPRESSION / LABELING:
PHENOTYPE:
|
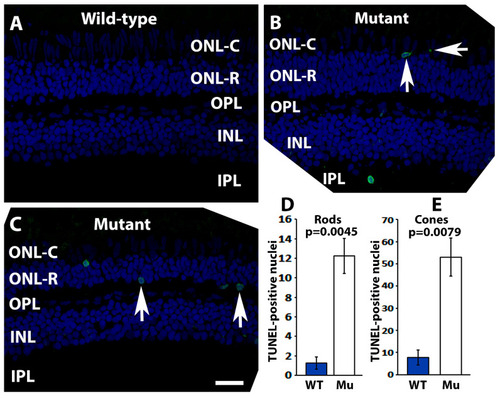
The quantity of TUNEL-positive photoreceptor nuclei was increased in pomt2 mutant retinas. A TUNEL assay was carried out on zebrafish retinal sections at 6-mpf (green fluorescence). The sections were counter-stained with DAPI (blue fluorescence). (A) Wild-type retina. (B) pomt2 mutant retina. Note examples of TUNEL-positive cone nuclei. (C) pomt2 mutant retina. Note examples of TUNEL-positive rod nuclei. (D) Quantification of TUNEL-positive rod nuclei (n = 4). The number of TUNEL-positive rod nuclei was significantly increased in pomt2 mutant retinas compared to the controls. (E) Quantification of TUNEL-positive cone nuclei (n = 4). The number of TUNEL-positive cone nuclei was significantly increased in pomt2 mutant retinas compared to the controls. Scale bar in C: 30 µm. PHENOTYPE:
|
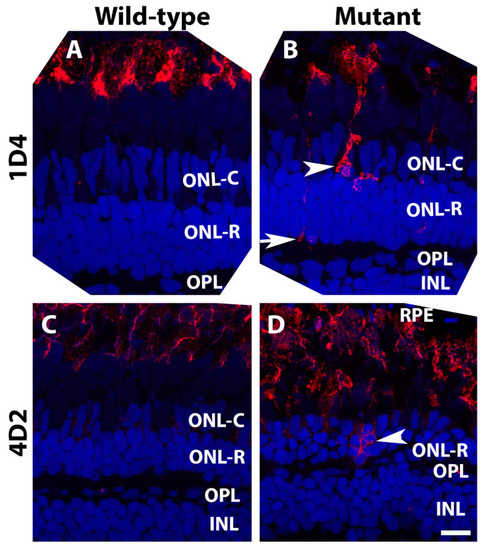
Opsin mis-localization was found in pomt2 mutant retinas. Retinal sections from zebrafish at 6-mpf were immunostained with antibodies 1D4 and 4D2 (red fluorescence) and counter-stained with DAPI (blue) (n = 3). (A) 1D4 immunostaining of a wild-type retina at 6-mpf. (B) 1D4 immunostaining of a homozygous pomt2sny5+13 mutant retina at 6-mpf. Note the presence of strongly 1D4-stained cell bodies (arrowhead) and terminals (arrow). (C) 4D2 immunostaining of a wild-type retina at 6-mpf. (D) 4D2 immunostaining of a homozygous pomt2sny5+13 mutant retina at 6-mpf. Note strongly 4D2 fluorescent cell bodies in the ONL. Scale bar in (D): 10 µm. |
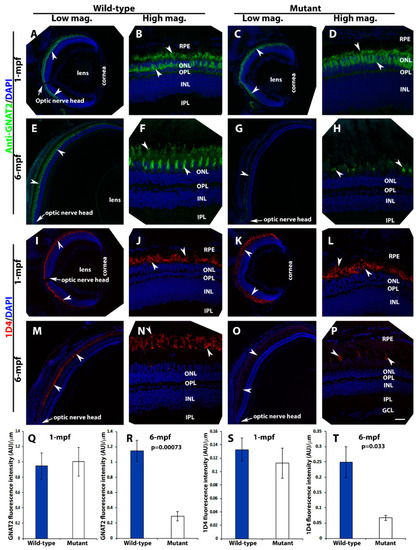
Loss of photoreceptors in pomt2 mutant retinas at 6-mpf but not 1-mpf. Zebrafish retinal sections at 1-mpf and 6-mpf were immunostained with GNAT2 antibody (green fluorescence, A–H) and 1D4 (red fluorescence, I–P). The sections were counter-stained with DAPI. To quantify loss of cone photoreceptors, GNAT2 and 1D4 immunoreactive intensities were measured (Q–T). (A,B) Wild-type GNAT2 immunostaining at 1-mpf. (C,D) Homozygous pomt2sny5+13 mutant GNAT2 immunostaining at 1-mpf showing similar immunoreactivity compared to the wild-type. (E,F) Wild-type GNAT2 immunostaining at 6-mpf. (G,H) Homozygous pomt2sny5+13 mutant GNAT2 immunostaining at 6-mpf showing reduced immunoreactivity compared to the wild-type. (I,J) Wild-type 1D4 immunostaining at 1-mpf. (K,L) Homozygous pomt2sny5+13 mutant 1D4 immunostaining at 1-mpf showing similar immunoreactivity compared to the wild-type. (M,N) Wild-type 1D4 immunostaining at 6-mpf. (O,P) Homozygous pomt2sny5+13 mutant 1D4 immunostaining at 6-mpf showing reduced immunoreactivity compared to the wild-type. (Q) GNAT2 immunofluorescence intensity (artificial units, AU) quantification of wild-type and mutant fish at 1-mpf (n = 3). There was no significant difference between wild-type and mutant retinas. (R) GNAT2 immunofluorescence intensity quantification of wild-type and mutant fish at 6-mpf (n = 3). GNAT2 immunoreactivity was significantly reduced in mutant retinas. (S) 1D4 immunofluorescence intensity quantification of wild-type and mutant fish at 1-mpf (n = 3). There was no significant difference between wild-type and mutant retinas. (T) 1D4 immunofluorescence intensity in the mutant retina was reduced at 6-mpf (n = 3). Arrowheads indicate examples of GNAT2 immunoreactivity (A-H) and 1D4 immunoreactiity (I-P). Arrows indicate location of optic nerve heads. Scale bar in P: 100 µm for all low magnification panels and 18.7 µm for all high magnification panels. EXPRESSION / LABELING:
PHENOTYPE:
|

ZFIN is incorporating published figure images and captions as part of an ongoing project. Figures from some publications have not yet been curated, or are not available for display because of copyright restrictions. PHENOTYPE:
|
|
ZFIN is incorporating published figure images and captions as part of an ongoing project. Figures from some publications have not yet been curated, or are not available for display because of copyright restrictions. PHENOTYPE:
|