|
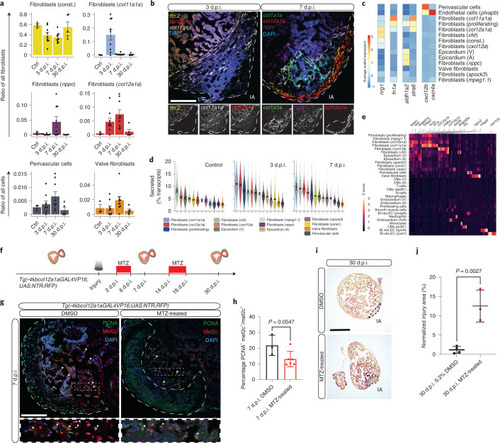
Identification of proregenerative cardiac fibroblasts.a, Cell number dynamics of selected fibroblast subclusters across the time points (n = 3, 9, 9, 5 animals; error bars show s.e.m.). b, Fluorescence in situ hybridization of marker genes. Left panel: const. fibroblasts (green), col12a1a fibroblasts (red) and nppc fibroblasts (purple) at 7 d.p.i. Right panel: col12a1a fibroblasts (red), col11a1a fibroblasts (white) and dedifferentiated CMs expressing ttn.2 (yellow) at 3 d.p.i. Injury areas (IA) are indicated with a dashed white line. Scale bar, 100 μm. c, Average expression of selected signalling genes in fibroblast subclusters. Blood vessel endothelial cells are included to show their interaction with perivascular cells via Cxcl12b–Cxcr4a signalling. d, Mean secretome expression of fibroblast cell types (n = 1,947, 8,611 and 17,261 cells; error bars indicate 3 × s.e.m.; y axis truncated for readability; full plots in Supplementary Fig. 10a). e, Differentially expressed secretome genes at 3 d.p.i. Genes with a reported function in regeneration, morphogenesis, tissue development or angiogenesis are highlighted (Bl. ves. EC: Blood vessel endothelial cells). f, Schematic of the ablation experiment for col12a1a-expressing cells. g, Immunostaining of sections of cryoinjured hearts of Tg(-4kbcol12a1aGAL4VP16;UAS:NTR:RFP) zebrafish treated with DMSO and MTZ at 7 d.p.i.; sections stained for Mef2c (CMs, red), PCNA (proliferation marker, green) and DNA (DAPI, blue). Arrowheads point to PCNA+ CMs; white dashed lines indicate IA. Scale bar, 100 μm. h, Percentages of PCNA+ CMs in DMSO-treated fish (n = 3) and MTZ-treated fish (n = 6) at 7 d.p.i. n represents biologically independent samples from two independent experiments. Data are shown as mean and s.d. Two-tailed unpaired Student’s t test, P = 0.0547. i, Histological comparison of the IA at 30 d.p.i. with and without MTZ treatment. Scale bar, 300 μm. j, Relative size of the IA across all histological replicates at 30 d.p.i. in 0.2% DMSO- (n = 4) and MTZ-treated (n = 3) samples. n represents biologically independent samples from two independent experiments. Data are shown as mean and s.d. Two-tailed unpaired Student’s t test, P = 0.0027. Source data
|

