IMAGE

Fig. 5

ID
ZDB-IMAGE-220809-5
Source
Figures for Hu et al., 2022
Image
Figure Caption

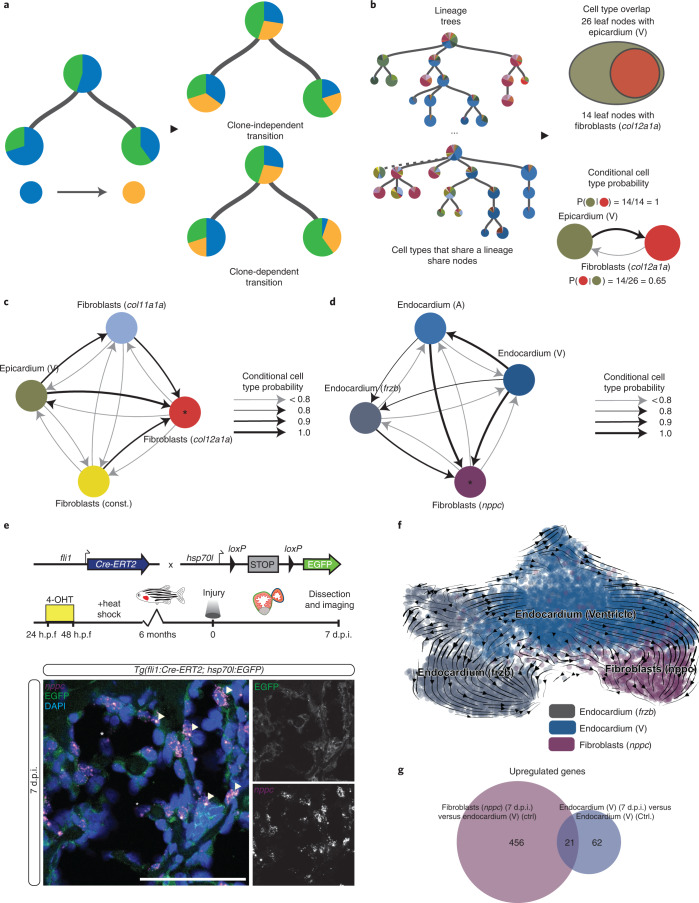
Fig. 5 Identification of endocardial fibroblasts.

a, Clone-independent transitions (for example 50%, top) showed similar transition rates across clones, leading to a strong correlation between yellow and blue cell types. Clone-dependent transition rates (for example 30% and 80%, bottom) caused yellow and blue cell types to lose correlation, requiring a different approach for lineage analysis. b, Conditional cell type probabilities could pinpoint lineage origins despite clone-dependent transitions. c, Conditional probabilities reproduced the epicardial lineage origin of col12a1a fibroblasts. d, Endocardial cell types were present in more than 80% of all nodes containing nppc, spock3 and valve fibroblasts. Asterisks in c and d indicate the queried cell type. e, Cre–lox lineage tracing confirmed the endocardial origin of nppc-expressing fibroblasts in cryoinjured hearts at 7 d.p.i. Sections were stained for GFP (green) and nppc (magenta). Arrowheads point to nppc and EGFP colocalization. Asterisks point to nppc-positive delaminating cells. Scale bar, 100 μm. f, Trajectory analysis revealed a potential transition from endocardial cells to nppc fibroblasts. g, Venn diagram of upregulated genes in nppc fibroblasts compared with activated endocardium (7 d.p.i.).

Source data

Acknowledgments
This image is the copyrighted work of the attributed author or publisher, and ZFIN has permission only to display this image to its users. Additional permissions should be obtained from the applicable author or publisher of the image. Full text @ Nat. Genet.