FIGURE SUMMARY
- Title
-
VARS2 Depletion Leads to Activation of the Integrated Stress Response and Disruptions in Mitochondrial Fatty Acid Oxidation
- Authors
- Kayvanpour, E., Wisdom, M., Lackner, M.K., Sedaghat-Hamedani, F., Boeckel, J.N., Müller, M., Eghbalian, R., Dudek, J., Doroudgar, S., Maack, C., Frey, N., Meder, B.
- Source
- Full text @ Int. J. Mol. Sci.
|
Figure 1. Phenotype of VARS2-MO-injected embryos in comparison to control-MO-injected embryos with 73% knockdown efficiency: n = 100 control-MO- and n = 100 splice-MO-injected embryos. Scale bar: 0.5mm (A). Heart rate and ventricular fractional shortening in control-MO- and splice-MO-injected embryos at 48h, 72h, and 96h post-fertilization (n = 25 each) (B). Gel electrophoresis showing a fraction of wild-type cDNA consisting of exons 2, 3, and 4 (241 bp) in control-MO-injected embryos and both wild-type and spliced cDNAs in splice-MO-injected embryos, with spliced cDNA missing exon 3 (159bp) (C). Whole-mount RNA antisense in situ hybridization showing expressions of atrial- and ventricle-specific myosin heavy chains as well as notch1b (D). v: ventricle, a: atrium, hpf: hours post-fertilization. Scale bar: 100µm.
PHENOTYPE:
|
|
Figure 2. VARS2 is mainly localized in the mitochondria of HEK293A cells. The scale bar is 10 µm long (A). VARS2 expression is significantly reduced according to mRNA and protein levels in HEK293A cells treated with VARS2-specific siRNAs compared to control siRNA (B). HEK293A cells treated with VARS2-specific siRNAs showed significantly increased diacylation/acylation ratio in valyl-tRNA according to northern blot analysis. n = 5, siSCR mean = 0.4, SD = 0.07; siVARS2-1 mean = 0.59, SD = 0.07, p = 0.0013; siVARS2-2 mean = 0.61, SD = 0.08, p = 0.0016 (C). **≤0.01, ***≤0.001.
|
|
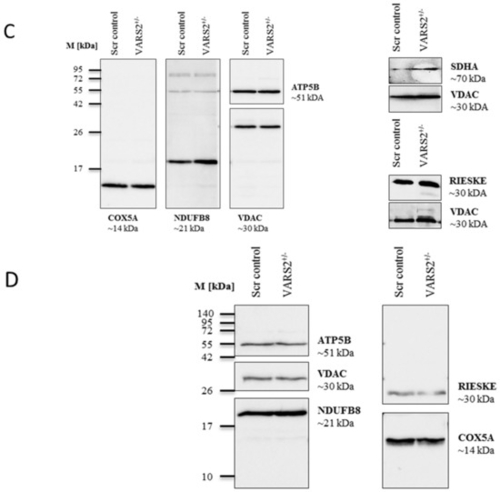
Figure 3. BN-PAGE analysis of respiratory chain supercomplex in mitochondria isolated from cells grown in glucose (A) or galactose (B). Western blot analysis of denatured respiratory subunits in mitochondria isolated from cells cultivated in glucose (C) or galactose (n = 1) (D). Mouse liver was run as a positive control.
|
|
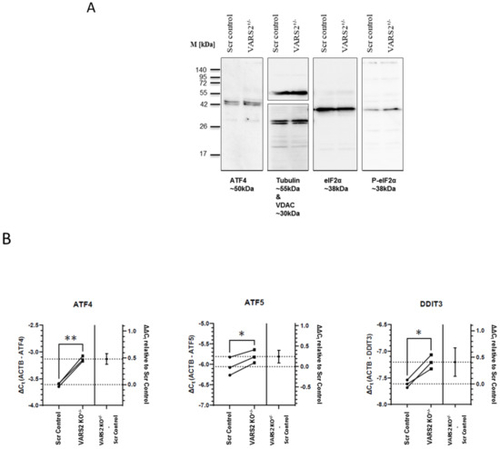
Figure 4. Western blot analyses showing a trend of a higher degree of eIF-2α phosphorylation in VARS2 KO+/− cells (2.25x) compared to the controls (A). RT-qPCR results indicating a higher level of ATF4, ATF5 and DDIT3 (CHOP) transcripts in the VARS2+/− compared to the control cell line (B). * = p < 0.05 and ** = p < 0.01.
|
|
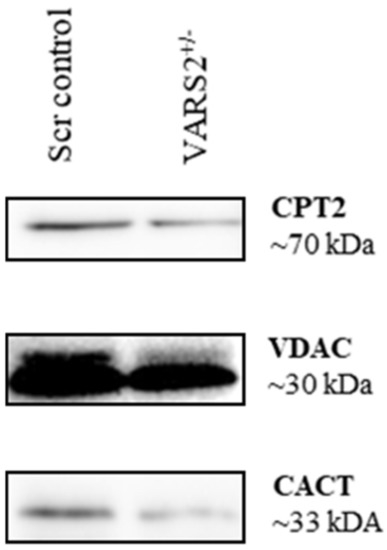
Figure 5. Western blot analyses revealing a trend of slightly lower protein levels of carnitine palmitoyltransferase 2 (CPT2) (64%) and carnitine/acylcarnitine translocase (CACT) (52%) in VARS2-depleted cells.
|
Acknowledgments
This image is the copyrighted work of the attributed author or publisher, and
ZFIN has permission only to display this image to its users.
Additional permissions should be obtained from the applicable author or publisher of the image.
Full text @ Int. J. Mol. Sci.


