
FIGURE
Fig. 4
- ID
- ZDB-FIG-220713-59
- Publication
- Kayvanpour et al., 2022 - VARS2 Depletion Leads to Activation of the Integrated Stress Response and Disruptions in Mitochondrial Fatty Acid Oxidation
- Other Figures
- All Figure Page
- Back to All Figure Page
Fig. 4
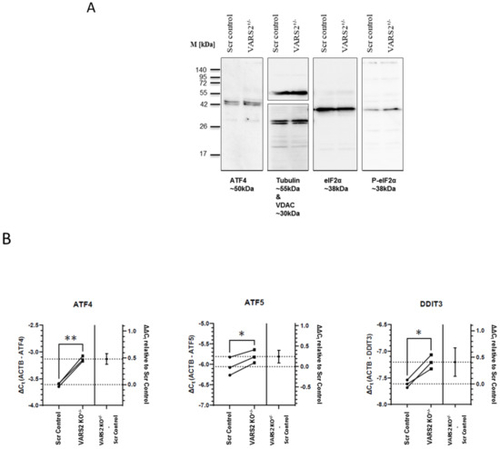
Figure 4. Western blot analyses showing a trend of a higher degree of eIF-2α phosphorylation in VARS2 KO+/− cells (2.25x) compared to the controls (A). RT-qPCR results indicating a higher level of ATF4, ATF5 and DDIT3 (CHOP) transcripts in the VARS2+/− compared to the control cell line (B). * = p < 0.05 and ** = p < 0.01.
|
Expression Data
Expression Detail
Antibody Labeling
Phenotype Data
Phenotype Detail
Acknowledgments
This image is the copyrighted work of the attributed author or publisher, and
ZFIN has permission only to display this image to its users.
Additional permissions should be obtained from the applicable author or publisher of the image.
Full text @ Int. J. Mol. Sci.