FIGURE SUMMARY
Title

UNC45A deficiency causes microvillus inclusion disease-like phenotype by impairing myosin VB-dependent apical trafficking

Authors
Duclaux-Loras, R., Lebreton, C., Berthelet, J., Charbit-Henrion, F., Nicolle, O., Revenu de Courtils, C., Waich, S., Valovka, T., Khiat, A., Rabant, M., Racine, C., Guerrera, I.C., Baptista, J., Mahe, M.M., Hess, M.W., Durel, B., Lefort, N., Banal, C., Parisot, M., Talbotec, C., Lacaille, F., Ecochard-Dugelay, E., Demir, A.M., Vogel, G.F., Faivre, L., Rodrigues, A., Fowler, D., Janecke, A.R., Müller, T., Huber, L.A., Rodrigues-Lima, F., Ruemmele, F.M., Uhlig, H.H., Del Bene, F., Michaux, G., Cerf-Bensussan, N., Parlato, M.
Source
Full text @ Journal of Clin. Invest.

ZFIN is incorporating published figure images and captions as part of an ongoing project. Figures from some publications have not yet been curated, or are not available for display because of copyright restrictions.

Genetics of 5 families with <italic toggle='yes'>UNC45A</italic> deficiency and molecular characterization of UNC45A variants.

(A) Pedigree of families with AR UNC45A deficiency (filled shapes indicate affected individuals). (B) Schematic representation of UNC45A protein showing location of the variants identified in this study. (C) Western blot analysis of UNC45A protein in HEK293T cells transfected with EV, WT, and mutant alleles (n = 2). (D) Ribbon representation of the human UNC45a model generated by MODELLER (based on the D. melanogaster and C. elegans UNC45 protein structures) showing its domain architecture. The variants were modeled in silico using Chimera. The location and a close-up view of each variant are shown. For the L237P and A838P mutations, hydrogen bonds are depicted by dark-blue dashed lines. For the T230R and E728K mutations, Van der Waals radii are represented for each atom and steric clashes occurring in the structure are shown with brown dashed lines. Coulombic surface representations are also shown. Red surface indicates the lowest electrostatic potential energy and blue the highest. Locations of the mutated residue are highlighted by a black circle. Distances are indicated using black dotted lines.

Histopathological and ultrastructural MVID features in the intestinal epithelium of patient.

(A) PAS and CD10 staining in control, P1, P2, and P4 duodenal biopsies. Scale bars: 20 μm. (BD) TEM of P1’s duodenal enterocytes showing ultrastructural features of MVID: regions containing vesicles and tubulovesicular structures (black arrowheads), enlarged lysosomes (green arrowheads), and swollen (i.e., stressed) endoplasmic reticulum (white arrowheads) as well as more or less complex or partially degraded MVIs (yellow arrowheads) and basolateral microvilli (pink arrowheads). Brush border showed defective microvilli anchored deep into the cytoplasm and thickened terminal web (blue arrowheads) or partially depleted microvilli (red arrowheads). Scale bars: 2 μm (B); 1 μm (C); 0.5 μm (D).

Disrupted enterocyte architecture in <italic toggle='yes'>UNC45A</italic> deficiency.

(A) Confocal images of polarized NT control and Unc45AKO Caco-2 cells grown on a filter and stained for an apical brush border marker DPPIV and actin. (B) Actin staining in polarized Caco-2 cells. Nuclei were visualized with HOECHST. Arrows on the left mark the corresponding XY and XZ planes. Scale bars: 20 μm. Panels A and B were from the same experiment. (C) NT control and UNC45AKO Caco-2 cells complemented or not with WT or mutant alleles were cultured in 3D for 5 days to form cysts. Nuclei are stained with Nucblue (blue); actin is stained with phalloidin AF 455 (red). Single confocal sections through the middle of the cyst are shown. Scale bars: 10 μm. (D) Single-lumen cysts were counted in each experiment. Results from 3 independent experiments (35 cysts each) are shown, 1-way ANOVA. ****P < 0.0001.

MYO5B as a client of the HSP90-UNC45A chaperone complex.

(A) Volcano plot showing proteins enriched in the myc-tagged UNC45A WT immunoprecipitates over the myc-tagged EV control identified by mass spectrometry in 3 independent pull-down assays. The difference of the average of the logarithm of Label Free Quantification (LQF) intensities (WT vs. EV) is plotted against negative logarithmic P values of a 2-sided, 2-sample Welsh t test. The hyperbolic curve delimitates significantly enriched proteins from common hits. High LFQ hits of interest are indicated in black (HSP90 family), in purple (Myosin protein family), and in green (Actin protein family). (B) Accumulation of myosin VB aggregates (aggresomes) in UNC45AKO cells treated with MG-132 (10 μM) overnight. Scale bars: 10 μm. n = 3. Nuclei are stained with Nucblue (blue).

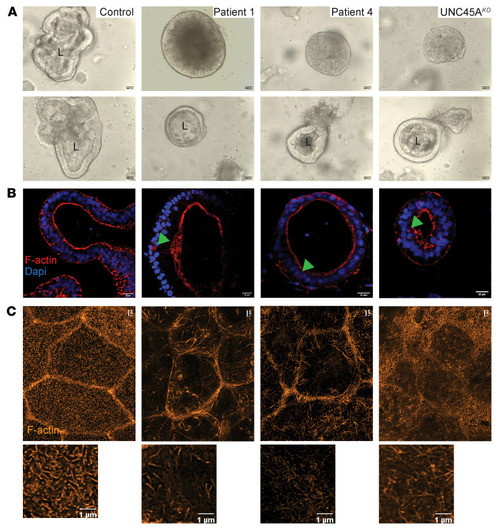
UNC45A-deficient organoids recapitulate MVID features.

(A) Bright-field images of control, P1, P4, and UNC45AKO1 3D organoids. Scale bar: 5000 μm. (B) F-actin staining revealing MVIs in the small subset of P1, P4, and UNC45AKO 3D organoids that display a central lumen. Scale bar: 20 μm. (C) STED image of F-actin at the apical pole of 2D enterocyte cultures derived from control, P1, P4, and UNC45AKO1 organoids after a 21-day culture on filters. Scale bars: 1 μm. L, lumen.

Impaired apical targeting in UNC45A-deficient patients.

(AC) Confocal imaging showing localization of Rab11 (A) and of apical transporters DRA (B) and NHE3 (C) in duodenum of control and patients. Scale bars: 20 μm.

MVID features in enterocytes of <italic toggle='yes'>unc45a</italic> zebrafish mutants.

(AC) Confocal microscopy analysis of the intestinal bulb of WT and unc45a–/– mutant larvae stained for villin and pERM (A), F-actin (phalloidin) (B), and Rab11 (C) at 5 dpf. Scale bars: 20 μm. Boxes showing microvillus-like inclusions are enlarged ×4. (D and E) TEMs of thin sections of intestinal bulb of 5 dpf WT and unc45a–/– mutant larvae showing defects in the organization of the brush border. Scale bars: 2 μm (D); 0.5 μm (E). Quantitative analysis showing decrease in microvillus length and density in unc45a–/– enterocytes as compared with WT enterocytes. Data are represented as mean + SD. ****P < 0.001, t test. N nucleus; MV microvilli.

Acknowledgments
This image is the copyrighted work of the attributed author or publisher, and ZFIN has permission only to display this image to its users. Additional permissions should be obtained from the applicable author or publisher of the image. Full text @ Journal of Clin. Invest.