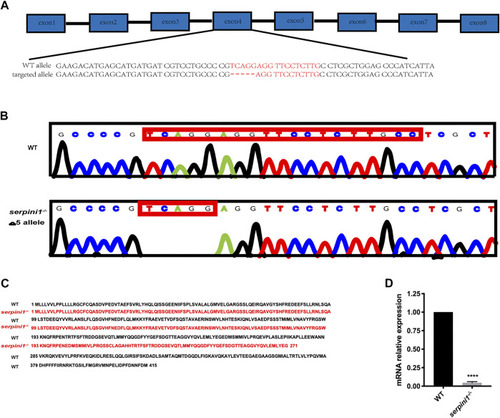
Generation of serpini1−/− zebrafish via CRISPR-CAS9 technique. (A): Schematic representation of CRISPR/Cas9 target sites in zebrafish gene serpini1. The 19 bp target site is located on the exon4 of the serpini1 gene. (B): DNA sequencing results of the wild-type (WT) and homozygote serpini1−/−. Serpini1−/− mutation leads to five-nucleotide deletion in the fourth exon. (C): Protein comparison for WT and serpini1−/− mutation. The serpini1−/− caused a frameshift mutation, truncated from 415 aa into a 271 aa protein. (D). mRNA level of serpini1 in serpini1−/− compared to WT. The data are presented as the mean ± SEM, N = 3 trails. Statistical analyses were performed with Student’s t-test, ****p < 0.0001 compared to WT.

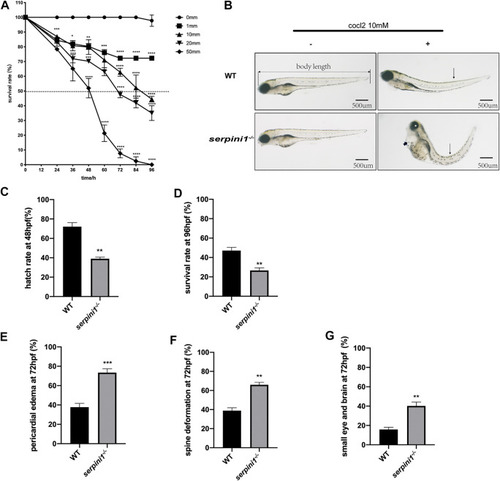
The developmental morphology defects of WT and serpini1−/− zebrafish under CoCl2 induced hypoxia damage. (A) Survival rates of WT under the different concentration of CoCl2: 0, 1, 10, 20, 50 mM from 12 hpf to 96 hpf. The data are presented as the mean ± SEM, n = 200 per group. Statistical analyses were performed with one-way ANOVA, followed by Dunnett’s multiple comparisons, *p < 0.05, **p < 0.01, ***p < 0.001, ****p < 0.0001 compared to WT at the same timepoint. Dash line indicates of 50% survival rate. (B) Typical morphological defects under the treatment of 10 mM CoCl2 in WT and serpini1−/− zebrafish at 4dpf; short arrow indicates pericardial edema; long arrow shows spine deformation and asterisk shows small eye deformation. (C) Hatch rate at 48 hpf under the treatment of 10 mM CoCl2 between WT and serpini1−/− group. The data are presented as the mean ± SEM, n = 200 per group; three trails for the experiment. Statistical analyses were performed with Student’s t-test, **p < 0.01 compared to WT. (D) Survival rate at 96 hpf under the treatment of 10 mM CoCl2 between WT and serpini1−/− group. The data are presented as the mean ± SEM, n = 200 per group; three trails for the experiment. Statistical analyses were performed with Student’s t-test, **p < 0.01 compared to WT. (E–G) Percentage of pericardial edema, spine deformation, and small eye and brain deformation in WT and serpini1−/− group under the treatment of 10 mM CoCl2. The data are presented as the mean ± SEM, n = 200 per group; three trails for the experiment. Statistical analyses were performed with Student’s t-test, **p < 0.01, ***p < 0.001.

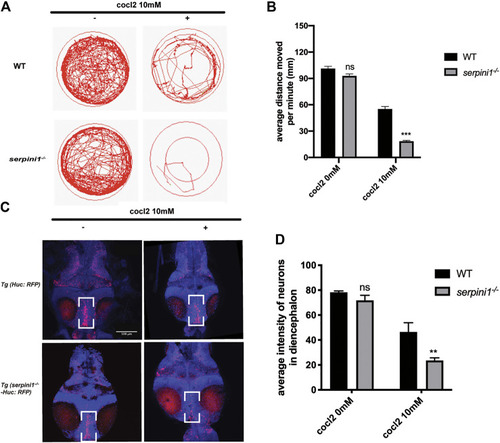
Neuroserpin deficient zebrafish showed reduced locomotor activities and more neurons loss in diencephalon area under CoCl2 induced hypoxic injury. (A) Representative graph for distance traveled in 40 min for WT and serpini1−/− zebrafish. (B) Quantification of average distance moved per minute in WT and serpini1−/− under 10 mM CoCl2 induced injury. The data are presented as the mean ± SEM, n = 96 per group. Statistical analyses were performed with Student’s t-test, ***p < 0.001, ns: no significant, compared with WT in the same CoCl2 concentration. (C) Images of neurons in diencephalon in Tg (Huc: RFP) and Tg (serpini1−/−-HuC: RFP) under 10 mM CoCl2 induced injury. Scale bar:100 um. (D) Quantification of average fluorescence intensity of neurons in diencephalon area in Tg (Huc: RFP) and Tg (serpini1−/−-HuC: RFP) under 10 mM CoCl2 induced injury. The data are presented as the mean ± SEM, n = 6 per group. Statistical analyses were performed with Student’s t-test, **p < 0.01, ns: no significant, compared with WT in the same CoCl2 concentration.

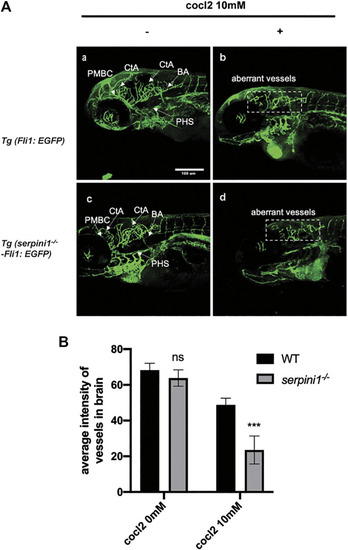
More severe vascular malformation in neuroserpin deficient zebrafish under CoCl2 induced hypoxic injury. (A) Image of vessels of Tg (Fli1: EGFP) and Tg (serpini1−/−-Fli1: EGFP) with or without 10 mM CoCl2 induced injury. Tg (Fli1: EGFP) and Tg (serpini1−/−-Fli1: EGFP) show normal vascular morphology in brain region including central artery (CtA), primordial hindbrain channel (PHBC), and primary head sinus (PHS). CoCl2 caused vascular malformation both in Tg (Fli1: EGFP) and Tg (serpini1−/−-Fli1: EGFP) under 10 mM CoCl2-induced injury. More reduced vascular branches in brain area were observed in Tg (serpini1−/−-Fli1: EGFP) group compared to Tg (Fli1: EGFP). Scale bar:100 um. White arrow indicates brain vessels. Dash white square box shows reduction of normal vessels in CoCl2 treated groups. (B) Quantification of average fluorescence intensity of vessels in brain area in Tg (Fli1: EGFP) and Tg (serpini1−/−-Fli1: EGFP) under 10 mM CoCl2 induced injury. The data are presented as the mean ± SEM, n = 6 per group. Statistical analyses were performed with Student’s t-test, ***p < 0.001, ns: no significant, compared with WT in the same CoCl2 concentration.

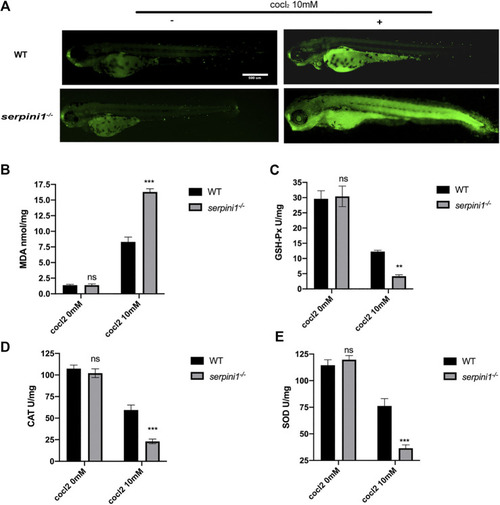
Apoptosis and oxidative stress were more severely enhanced in serpini1−/− zebrafish group under CoCl2 induced hypoxic injury. (A) AO staining of the apoptotic cells in the live image of WT and serpini1−/− zebrafish under the treatment of 10 mM CoCl2 at 4dpf. Scale bar:500 um. (B) MDA content in WT and serpini1−/− under 10 mM CoCl2 induced injury. The data are presented as the mean ± SEM, n = 100 per group. Three trails for the experiment. Statistical analyses were performed with Student’s t-test, ***p < 0.001 compared with WT, ns: no significant. (C) The level of GSH-Px in WT and serpini1−/− under 10 mM CoCl2 induced injury. The data are presented as the mean ± SEM, n = 100 per group. Three trails for the experiment. Statistical analyses were performed with Student’s t-test, **p < 0.01 compared with WT, ns: no significant. (D) The level of CAT in WT and serpini1−/− under 10 mM CoCl2 induced injury. The data are presented as the mean ± SEM, n = 100 per group. Three trails for the experiment. Statistical analyses were performed with Student’s t-test, ***p < 0.001 compared with WT, ns: no significant. (E) The level of SOD in WT and serpini1−/− under 10 mM CoCl2 induced injury. The data are presented as the mean ± SEM, n = 100 per group. Three trails for the experiment. Statistical analyses were performed with Student’s t-test, ***p < 0.001 compared with WT, ns: no significant.

Acknowledgments
This image is the copyrighted work of the attributed author or publisher, and ZFIN has permission only to display this image to its users. Additional permissions should be obtained from the applicable author or publisher of the image. Full text @ Front Pharmacol