IMAGE

FIGURE 2

ID
ZDB-IMAGE-210321-4
Source
Figures for Han et al., 2021
Image
Figure Caption

FIGURE 2

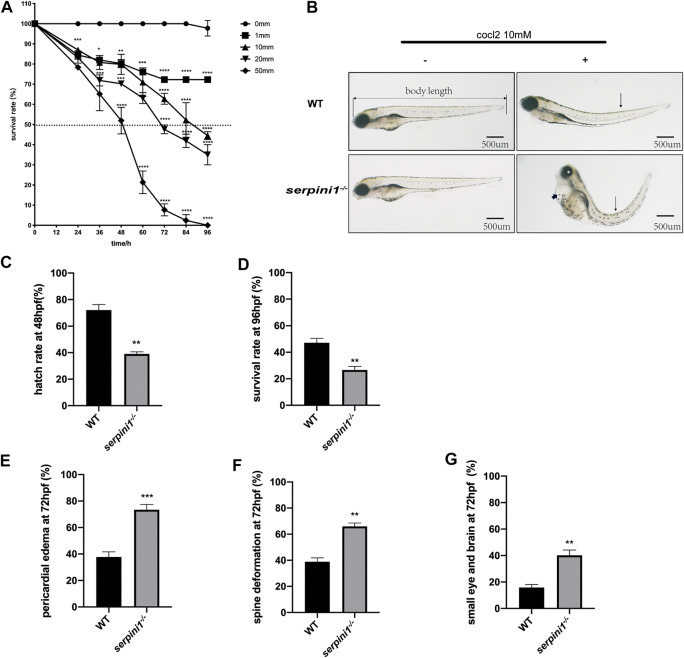
The developmental morphology defects of WT and serpini1−/− zebrafish under CoCl2 induced hypoxia damage. (A) Survival rates of WT under the different concentration of CoCl2: 0, 1, 10, 20, 50 mM from 12 hpf to 96 hpf. The data are presented as the mean ± SEM, n = 200 per group. Statistical analyses were performed with one-way ANOVA, followed by Dunnett’s multiple comparisons, *p < 0.05, **p < 0.01, ***p < 0.001, ****p < 0.0001 compared to WT at the same timepoint. Dash line indicates of 50% survival rate. (B) Typical morphological defects under the treatment of 10 mM CoCl2 in WT and serpini1−/− zebrafish at 4dpf; short arrow indicates pericardial edema; long arrow shows spine deformation and asterisk shows small eye deformation. (C) Hatch rate at 48 hpf under the treatment of 10 mM CoCl2 between WT and serpini1−/− group. The data are presented as the mean ± SEM, n = 200 per group; three trails for the experiment. Statistical analyses were performed with Student’s t-test, **p < 0.01 compared to WT. (D) Survival rate at 96 hpf under the treatment of 10 mM CoCl2 between WT and serpini1−/− group. The data are presented as the mean ± SEM, n = 200 per group; three trails for the experiment. Statistical analyses were performed with Student’s t-test, **p < 0.01 compared to WT. (E–G) Percentage of pericardial edema, spine deformation, and small eye and brain deformation in WT and serpini1−/− group under the treatment of 10 mM CoCl2. The data are presented as the mean ± SEM, n = 200 per group; three trails for the experiment. Statistical analyses were performed with Student’s t-test, **p < 0.01, ***p < 0.001.

Figure Data
Acknowledgments
This image is the copyrighted work of the attributed author or publisher, and ZFIN has permission only to display this image to its users. Additional permissions should be obtained from the applicable author or publisher of the image. Full text @ Front Pharmacol