
- Title
-
Nradd Acts as a Negative Feedback Regulator of Wnt/β-Catenin Signaling and Promotes Apoptosis
- Authors
- Ozalp, O., Cark, O., Azbazdar, Y., Haykir, B., Cucun, G., Kucukaylak, I., Alkan-Yesilyurt, G., Sezgin, E., Ozhan, G.
- Source
- Full text @ Biomolecules
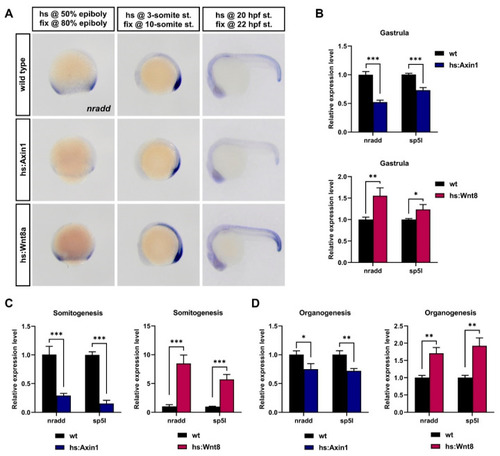
nradd is transcriptionally regulated by Wnt/β-catenin signaling during development. (A) Whole-mount in situ hybridization (WMISH) shows that nradd expression is downregulated in transgenic embryos expressing Axin1 (hs:Axin1) and upregulated in transgenic embryos expressing Wnt8a (hs:Wnt8a) at gastrula (80% epiboly), somitogenesis (10-somite) and organogenesis (22 hpf) stages. (n (80% epiboly): wild type 21/21 embryos, hs:Axin1 18/20 embryos, hs:Wnt8a 16/17; n (10-somite st.): wild type 24/24 embryos, hs:Axin1 24/24 embryos, hs:Wnt8a 28/30; n (22 hpf st.): wild type 19/19 embryos, hs:Axin1 23/25 embryos, hs:Wnt8a 19/20) hs: heat shock, fix: fixation, st: stage, hpf: hours post-fertilization. Three independent experiments were conducted. (B–D) nradd and sp5l expression levels determined by qPCR in hs:Axin1 and hs:Wnt8a transgenic embryos are shown relative to those in wild-type embryos at (B) gastrula, (C) somitogenesis and (D) organogenesis stages. Statistical significance was evaluated using an unpaired t-test. * p < 0.05, ** p < 0.01 and *** p < 0.001. Error bars represent ± standard deviation (SD, n = 3). Three independent experiments were conducted. EXPRESSION / LABELING:
PHENOTYPE:
|
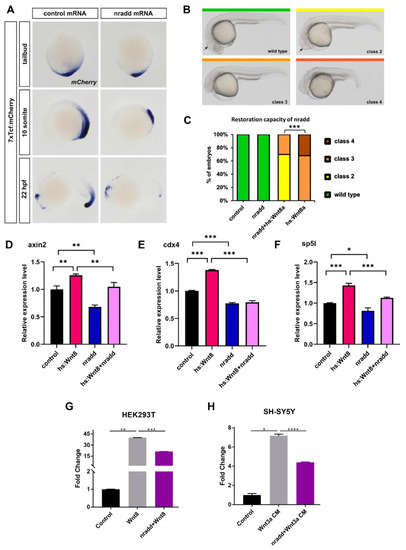
nradd acts as an inhibitor of Wnt/β-catenin signaling. (A) Wnt/β-catenin reporter activity is reduced in 7xTcf:mCherry embryos injected with 250 pg nradd mRNA. (n (tailbud): control 26/26 embryos, nradd 27/31 embryos; n (10-somite): control 26/26 embryos, nradd 25/26 embryos, n (22 hpf): control 21/21 embryos, nradd 29/30 embryos). Three independent experiments were conducted. (B) Classification of phenotypes at 24 hpf caused by wnt8 overexpression in hs:Wnt8a transgenic embryos after 1 hour of heat shock during gastrulation. Class 2: no eyes, reduced forebrain, normal midbrain–hindbrain boundary (mhb, arrow), class 3: no forebrain, severely reduced midbrain, no mhb, class 4: abnormal notochord development. (C) Phenotypes in wild-type (wt) or hs:Wnt8 transgenic embryos injected with nradd mRNA (150 pg) or equimolar amounts of control mRNA heat shocked at shield stage during gastrulation and scored at 24 hpf. Nradd rescues Wnt8-induced phenotypes. (n (tailbud): control 53 embryos, nradd 46 embryos, nradd+hs:Wnt8a 56 embryos, hs:Wnt8a 45 embryos). Three independent experiments were conducted. (D–F) Expression levels of direct Wnt-target genes axin2, cdx4 and sp5l determined by qPCR in nradd-overexpressing wt embryos (nradd) relative to those in wt embryos injected with GFP mRNA (control) and in nradd-overexpressing hs:Wnt8 embryos (hs:Wnt8+nradd) relative to those in hs:Wnt8 embryos injected with GFP mRNA (hs:Wnt8). All target genes are reduced by nradd in both wt and hs:Wnt8 embryos. Statistical significance was evaluated using an unpaired t-test. * p < 0.05, ** p < 0.01 and *** p < 0.001. Error bars represent ± standard deviation (SD, n = 3). Three independent experiments were conducted. (G–H) Average and SD of the mean (error bars) values of pBAR luciferase reporter activity monitoring Wnt/β-catenin signaling activity (normalized to renilla luciferase activity) in (G) HEK293T and (H) SH-SY5Y cells where Wnt/β-catenin signaling is activated by Wnt8 or Wnt3a conditioned media (CM) and transfected with Nradd. Nradd significantly inhibited Wnt signaling in both cell lines. Statistical significance was evaluated using an unpaired t-test. * p < 0.05, ** p < 0.01, *** p < 0.001 and **** p < 0.0001. Error bars represent SD. Three independent experiments were performed. |
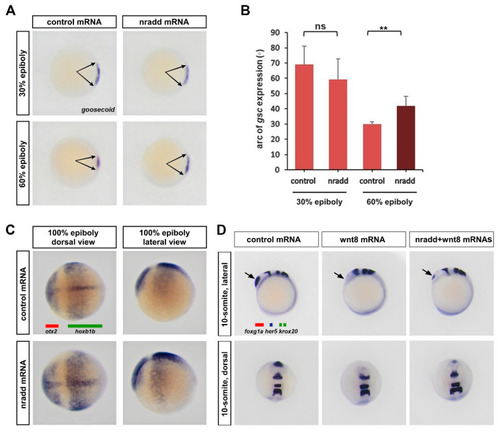
nradd suppresses Wnt-mediated patterning of the mesoderm and the neuroectoderm. (A) nradd mRNA (250 pg) causes expansion of the dorsal organizer domain (arrows) marked by goosecoid (gsc) WMISH, not at late blastula (30% epiboly, n: control 23/23 embryos, nradd 26/29 embryos), but at early gastrula (60% epiboly, n: control 27/27 embryos, nradd 32/33 embryos) stage zebrafish embryos. Three independent experiments were conducted. (B) Quantification of gsc expression shown in (A) by measurement of arc degree (29 embryos in control 30% epiboly, 33 embryos in nradd 30% epiboly, 35 embryos in control 60% epiboly, 37 embryos in nradd 60% epiboly). Error bars are SD. ** indicates p < 0.01 and ns is non-significant. (C) nradd mRNA (250 pg) results in expansion of the anterior neuroectodermal marker otx2 (red bar) and a complementary reduction of the posterior neuroectodermal marker hoxb1b (green bar) defined by WMISH at the 100% epiboly stage (n: control 35/35 embryos, nradd 38/41 embryos). Three independent experiments were conducted. (D) nradd mRNA (250 pg) restores the telencephalon, marked by foxg1a (arrowhead), that is completely abolished by wnt8 mRNA (20 pg). WMISH is performed to detect expression of three independent RNAs, the forebrain marker foxg1a (red bar), the midbrain–hindbrain boundary marker her5 (blue bar) and the rhombomere 3/5 marker krox20 (two green bars) in zebrafish embryos at the 10-somite stage (n: control 33/33 embryos, wnt8 35/36 embryos, nradd+wnt8 42/45 embryos). Three independent experiments were conducted. |
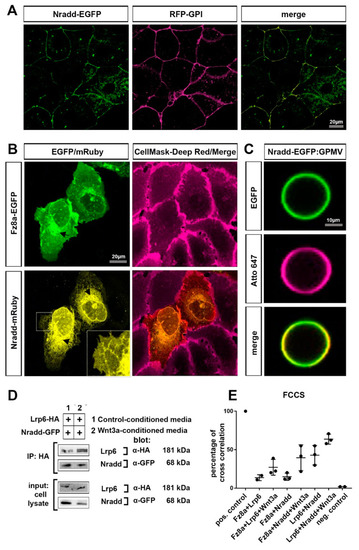
Nradd localizes to the plasma membrane and interacts with the Wnt–receptor complex (A) Nradd-EGFP (green) and RFP-GPI (red) localize at the plasma membrane of the enveloping layer cells of zebrafish embryos at 4 hpf (dome stage). (B) In U2OS cells, Fz8a-EGFP (green) co-localizes with the CellMask Deep Red (red) at the plasma membrane while Nradd-mRuby (yellow) localizes to the ER, but a significant fraction of it is in the plasma membrane, as seen from the zoom-in inset image. Arrows indicate protein transport from the ER to the plasma membrane. (C) Nradd-EGFP (green) localizes to the surface of cell-derived giant plasma membrane vesicles (GPMVs) and overlaps with the plasma membrane marker Atto647N-PE (red). (D) Nradd-GFP co-immunoprecipitates with Lrp6-HA in HEK293T cells. Three independent experiments were performed. (E) Fluorescence cross-correlation spectroscopy (FCCS) measurements show cross-correlation percentages between Fz8a-Lrp6, Fz8a-Nradd and Lrp6-Nradd, with/without Wnt3a stimulation at the plasma membrane. Nradd co-diffuses with Fz8a and Lrp6 at the membrane and this co-diffusion is enhanced by Wnt3 stimulation. EGFP and mCherry proteins were used as negative controls and their cross-correlation percentage is 1.70%. |
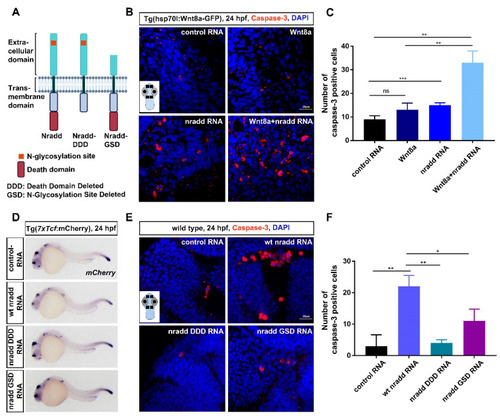
Nradd acts together with Wnt/β-catenin signaling to promote apoptosis during development. (A) Schematic representation shows domain structures of wt Nradd, Nradd without the death domain (Nradd death domain deleted (DDD)) and Nradd without the N-glycosylated N-terminal region (Nradd glycosylation site deleted (GSD)). (B) Anti-cleaved caspase 3 staining of control, Wnt8a activated, nradd mRNA-injected and Wnt8a activated+nradd mRNA-injected zebrafish embryos at 24 hpf. Sections are counterstained for DAPI. The inset shows a representative embryo with four different regions indicated with black rectangles that are used for counting the cleaved caspase 3-positive cells. The embryo image is created with BioRender.com. Scale bar: 20 μm. nradd mRNA (250 pg) induces apoptosis in zebrafish embryos compared to control group and also acts together with Wnt8a to further enhance apoptosis. The experiment was performed in hs:Wnt8 transgenic embryos where Wnt8a expression is induced by giving a heat shock at 60% epiboly. Four independent experiments were conducted. (C) Quantification of cleaved caspase 3-positive apoptotic cells shown in (B). Numbers represent average number of apoptotic cells counted from four different regions of 20 embryos for each group. Error bars are SD, ** indicates p < 0.01 and *** indicates p < 0.001. (D) WMISH showing the loss of capacity in nradd DDD (250 pg) and nradd GSD (250 pg) mRNA to inhibit canonical Wnt signaling. mCherry WMISH shows downregulation of signaling in the transgenic 7xTcf:mCherry Wnt/β-catenin reporter embryos by wt nradd (58/61). Overexpression of nradd DDD (44/46) or nradd GSD (51/52) cannot inhibit Wnt/β-catenin signaling. Three independent experiments were conducted. (E) Anti-cleaved caspase 3 staining of control (100 pg), wt nradd (250 pg), nradd DDD (250 pg) and nradd GSD (250 pg) mRNA-injected zebrafish embryos at 24 hpf. Sections are counterstained for DAPI. The inset shows a representative embryo with four different regions indicated with black rectangles that are used for counting the cleaved caspase 3-positive cells. Scale bar: 20 μm. nradd mRNA (250 pg) induces apoptosis in zebrafish embryos compared to control group, while nradd DDD or nradd GSD cannot. Three independent experiments were conducted. (F) Quantification of cleaved caspase 3-positive apoptotic cells shown in (E). Numbers represent average number of apoptotic cells counted from four different regions of 20 embryos for each group. Error bars are SD, * indicates p < 0.05 and ** indicates p < 0.01. |
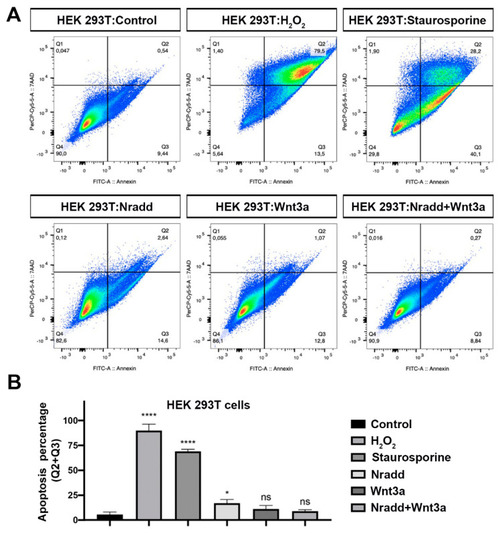
Zebrafish Nradd promotes apoptosis in human embryonic kidney cells. (A) Apoptosis assay on HEK293T cells using flow cytometry after staining with annexin V-FITC and 7AAD. Representative scatter plots of 7AAD (y-axis) vs. annexin V-FITC (x-axis). Nradd significantly enhances apoptosis. (B) Percentage of apoptotic cells, * indicates p < 0.05, **** is p < 0.0001 and ns is non-significant. All experiments were performed in five replicates. Three independent experiments were conducted. |
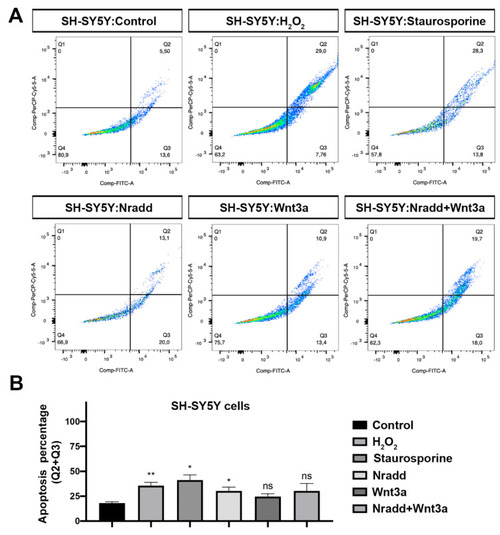
Zebrafish Nradd enhances apoptosis in neuroblastoma cells. (A) Apoptosis assay on SH-SY5Y cells using flow cytometry after staining with annexin V-FITC and 7AAD. Representative scatter plots of 7AAD (y-axis) vs. annexin V-FITC (x-axis). Nradd significantly induces apoptosis. (B) Percentage of apoptotic cells, * indicates p < 0.05, ** is p < 0.01 and ns is non-significant. All experiments were performed in five replicates. Three independent experiments were conducted. |