
|
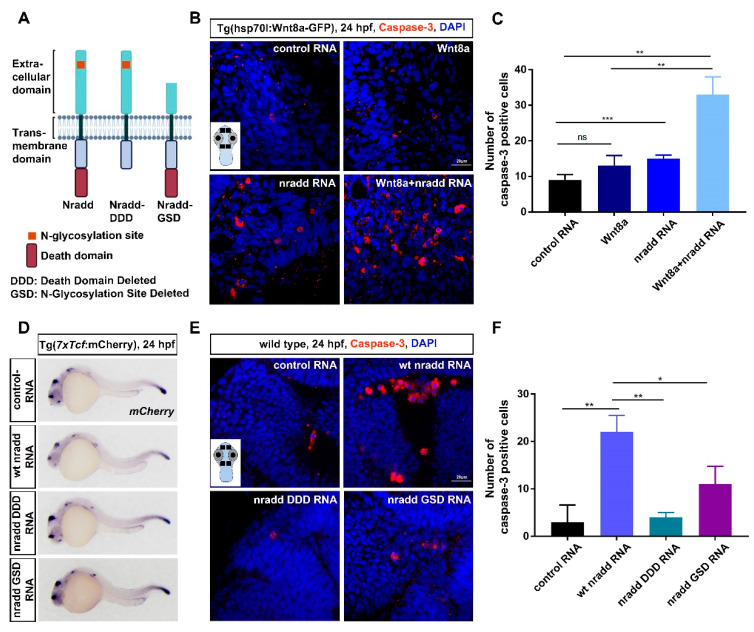
Figure 5 Nradd acts together with Wnt/β-catenin signaling to promote apoptosis during development. (A) Schematic representation shows domain structures of wt Nradd, Nradd without the death domain (Nradd death domain deleted (DDD)) and Nradd without the N-glycosylated N-terminal region (Nradd glycosylation site deleted (GSD)). (B) Anti-cleaved caspase 3 staining of control, Wnt8a activated, nradd mRNA-injected and Wnt8a activated+nradd mRNA-injected zebrafish embryos at 24 hpf. Sections are counterstained for DAPI. The inset shows a representative embryo with four different regions indicated with black rectangles that are used for counting the cleaved caspase 3-positive cells. The embryo image is created with BioRender.com. Scale bar: 20 μm. nradd mRNA (250 pg) induces apoptosis in zebrafish embryos compared to control group and also acts together with Wnt8a to further enhance apoptosis. The experiment was performed in hs:Wnt8 transgenic embryos where Wnt8a expression is induced by giving a heat shock at 60% epiboly. Four independent experiments were conducted. (C) Quantification of cleaved caspase 3-positive apoptotic cells shown in (B). Numbers represent average number of apoptotic cells counted from four different regions of 20 embryos for each group. Error bars are SD, ** indicates p < 0.01 and *** indicates p < 0.001. (D) WMISH showing the loss of capacity in nradd DDD (250 pg) and nradd GSD (250 pg) mRNA to inhibit canonical Wnt signaling. mCherry WMISH shows downregulation of signaling in the transgenic 7xTcf:mCherry Wnt/β-catenin reporter embryos by wt nradd (58/61). Overexpression of nradd DDD (44/46) or nradd GSD (51/52) cannot inhibit Wnt/β-catenin signaling. Three independent experiments were conducted. (E) Anti-cleaved caspase 3 staining of control (100 pg), wt nradd (250 pg), nradd DDD (250 pg) and nradd GSD (250 pg) mRNA-injected zebrafish embryos at 24 hpf. Sections are counterstained for DAPI. The inset shows a representative embryo with four different regions indicated with black rectangles that are used for counting the cleaved caspase 3-positive cells. Scale bar: 20 μm. nradd mRNA (250 pg) induces apoptosis in zebrafish embryos compared to control group, while nradd DDD or nradd GSD cannot. Three independent experiments were conducted. (F) Quantification of cleaved caspase 3-positive apoptotic cells shown in (E). Numbers represent average number of apoptotic cells counted from four different regions of 20 embryos for each group. Error bars are SD, * indicates p < 0.05 and ** indicates p < 0.01.