FIGURE SUMMARY
Title

The Downregulation of c19orf12 Negatively Affects Neuronal and Musculature Development in Zebrafish Embryos

Authors
Mignani, L., Zizioli, D., Borsani, G., Monti, E., Finazzi, D.
Source
Full text @ Front Cell Dev Biol

ZFIN is incorporating published figure images and captions as part of an ongoing project. Figures from some publications have not yet been curated, or are not available for display because of copyright restrictions.

EXPRESSION / LABELING:
Genes:
Fish:
Anatomical Term:
Stage Range: 64-cell to Days 7-13

ZFIN is incorporating published figure images and captions as part of an ongoing project. Figures from some publications have not yet been curated, or are not available for display because of copyright restrictions.

EXPRESSION / LABELING:
Genes:
Fish:
Anatomical Term:
Stage Range: 256-cell to 20-25 somites

ZFIN is incorporating published figure images and captions as part of an ongoing project. Figures from some publications have not yet been curated, or are not available for display because of copyright restrictions.

ZFIN is incorporating published figure images and captions as part of an ongoing project. Figures from some publications have not yet been curated, or are not available for display because of copyright restrictions.

PHENOTYPE:
Fish:
Knockdown Reagent:
Observed In:
Stage: Long-pec

ZFIN is incorporating published figure images and captions as part of an ongoing project. Figures from some publications have not yet been curated, or are not available for display because of copyright restrictions.

PHENOTYPE:
Fish:
Knockdown Reagent:
Observed In:
Stage: Long-pec

Spatio-temporal analysis of gene a expression in zebrafish embryos. Representative images of embryos at early (A) or later (B) stages of development, hybridized with a probe specific for c19orf12a mRNA. Numbers in each panel represent embryos used for the experiment and embryos with the result shown in the image. Each hybridization was performed at least twice. Scale bars = 500 μm. mb, midbrain; mhb, midbrain-hindbrain boundary; h, hindbrain; ot, optic tectum.

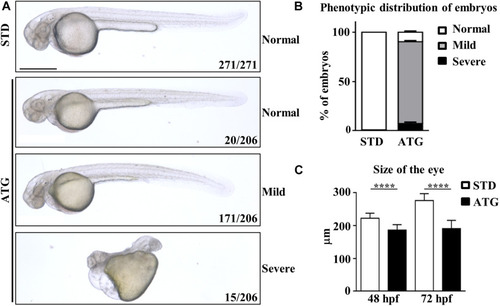
Morphological analysis of embryos micro-injected with an ATG-blocking morpholino. Embryos were injected with the gene a-specific (ATG) or the control (STD) morpholino at 1/2 cell stage and analyzed at the microscope at 48 and 72 hpf. (A) Representative images showing the main features of controls and morphants at 48 hpf. Numbers in each panel represent total embryos used for the experiment and embryos with the phenotype shown in the image. (B) The graph shows the percentage distribution of embryos with normal or abnormal (mild and severe) morphology in each microinjection category. (C) The graph show the mean size of the eye diameter in controls and morphants (N > 40) at 48 and 72 hpf. Size bar = 500 μm. ****P < 0.0001 (unpaired, two-tailed T-Test). Experiments were repeated at least three times.

Assessment of the specificity of the phenotype. (A) Embryos were injected with ATG-MO for gene a alone or together with an equimolar dose of p53-MO. (B) The graph shows the size of the eyes in embryos as in (A). Two biological replicates were performed. ****P < 0.001. (C) Embryos were injected with ATG-MO for gene a alone or together with human C19orf12 mRNA, either WT or MUT, and the morphology analyzed at 48 hpf. The graph shows the percentage distribution of embryos in the different phenotypes (normal, mild, and severe) in the three categories of embryos. At least three experiments were performed and more than 150 embryos of each type were analyzed.

PHENOTYPE:
Fish:
Knockdown Reagents:
Observed In:
Stage: Long-pec

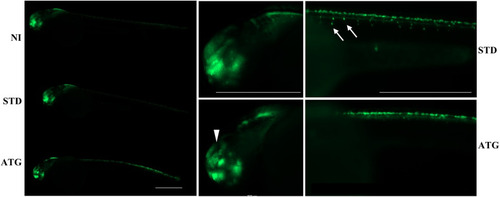
neurog1-dependent EGFP fluorescence in embryos injected with control (STD) or ATG morpholinos. Lateral views of Tg(neurog1:EGFP) embryos either injected or not with STD or ATG morpholinos, at 48 hpf, with different magnifications. The arrowhead points to the region in the midbrain (tectum opticum) that shows a clear reduction of the signal in morphants. Arrows point to drg neurons, normally labeled in STD-injected embryos, but not visible in morphants. Size bar = 500 μm. Experiments were repeated at least three times and altogether more than 120 embryos of each type were viewed.

EXPRESSION / LABELING:
Gene:
Fish:
Knockdown Reagent:
Anatomical Terms:
Stage: Long-pec
PHENOTYPE:
Fish:
Knockdown Reagent:
Observed In:
Stage: Long-pec

neurod1-dependent EGFP fluorescence in embryos injected with control (STD) or ATG morpholinos. (A) Representative lateral and dorsal views of Tg(neurod1:EGFP) embryos either injected with STD or ATG morpholinos, at 48 hpf, Size bar = 500 μm. Experiments were repeated at least three times and altogether more than 150 embryos of each type were analyzed. (B) Lightsheet imaging of embryos described in panel (A). Four embryos with mild morphological phenotype were randomly selected and analyzed in two different experiments. Arrows point to the regions that are clearly missing or less visible in ATG-morphants.

EXPRESSION / LABELING:
Gene:
Fish:
Knockdown Reagent:
Anatomical Terms:
Stage: Long-pec
PHENOTYPE:
Fish:
Knockdown Reagent:
Observed In:
Stage: Long-pec

Birefringence analysis and F-actin staining. (A) Birefringence quantification in embryos injected with STD or ATG morpholino at 48 hpf. (B) Embryos were incubated with fluorescent phalloidin to stain F-actin. Representative lateral views of stained embryos showing the clear reduction of the total fluorescence intensity in ATG-morphants. Images were acquired with the same parameter, as described in section “Materials and Methods.” (C) Lightsheet imaging of a section of the trunk in the embryos as in (A). The image of the ATG-morphant was adjusted in order to show a fluorescence intensity comparable to that of the control embryo (STD). (D) Quantification of the fluorescence of embryos shown in (A), acquired by ZF-Mapper software. (E) Mean size of the trunk in control and ATG-morphants at 48 hpf, measured as described in section “Materials and Methods.” Three (birefringence) and two biological replicates (phalloidin staining) were performed. Numbers in each image indicate the total number of embryos analyzed. Size bar = 500 μm. ****P < 0.0001 (unpaired, two-tailed T-test).

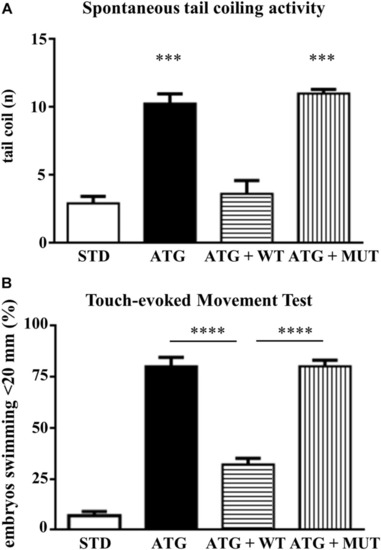
Analysis of locomotor behavior. (A) The graph shows the number of spontaneous flipping movements during 1 min observation in embryos at 24 hpf, injected with STD or ATG morpholino, together with either WT or MUT human C19orf12 mRNA. (B) The graph resumes the main results from the analysis of the swimming performance of embryos of the same categories as in (A), at 48 hpf in the touch-evoked test. Bars represent the percentage of embryos covering a distance lower than 20 mm. ****P < 0.0001 (One way ANOVA, corrected with Tukey’s multiple comparisons test).

PHENOTYPE:
Fish:
Knockdown Reagent:
Observed In:
Stage: Long-pec
Acknowledgments
This image is the copyrighted work of the attributed author or publisher, and ZFIN has permission only to display this image to its users. Additional permissions should be obtained from the applicable author or publisher of the image. Full text @ Front Cell Dev Biol