IMAGE

FIGURE 7

ID
ZDB-IMAGE-210113-33
Source
Figures for Mignani et al., 2020
Image
Figure Caption

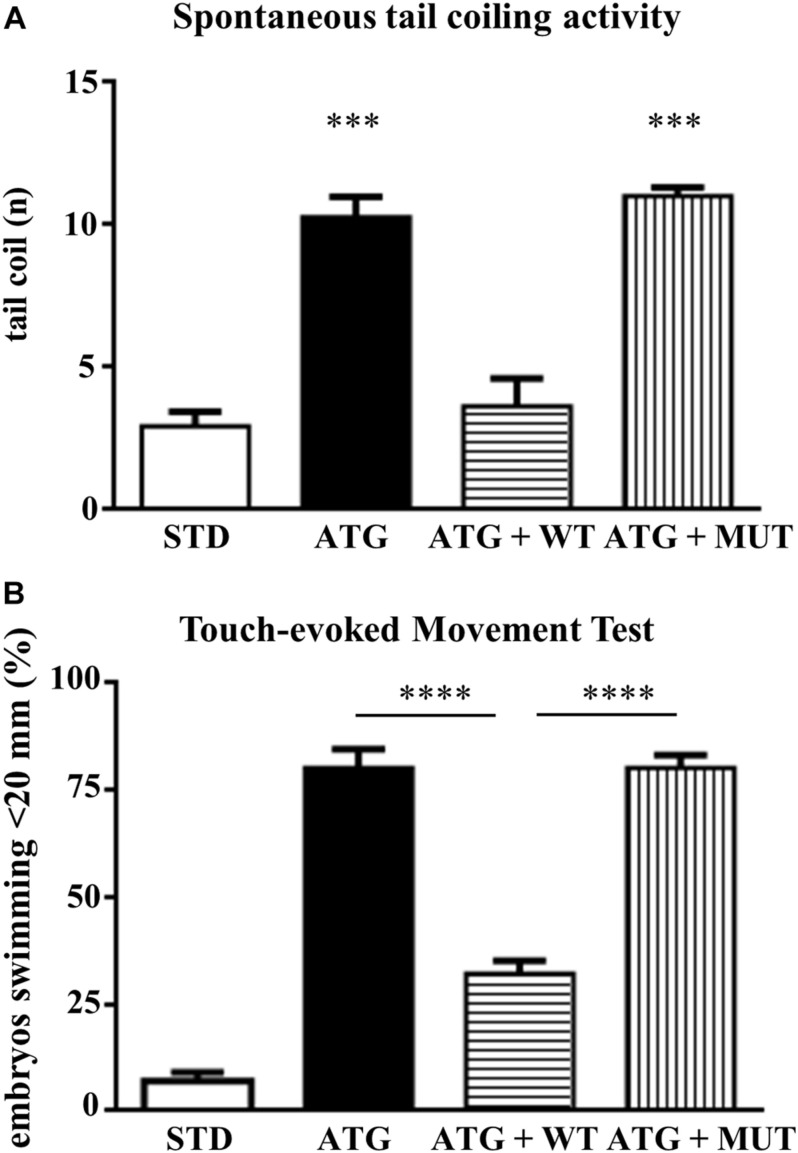
FIGURE 7

Analysis of locomotor behavior. (A) The graph shows the number of spontaneous flipping movements during 1 min observation in embryos at 24 hpf, injected with STD or ATG morpholino, together with either WT or MUT human C19orf12 mRNA. (B) The graph resumes the main results from the analysis of the swimming performance of embryos of the same categories as in (A), at 48 hpf in the touch-evoked test. Bars represent the percentage of embryos covering a distance lower than 20 mm. ****P < 0.0001 (One way ANOVA, corrected with Tukey’s multiple comparisons test).

Figure Data
Acknowledgments
This image is the copyrighted work of the attributed author or publisher, and ZFIN has permission only to display this image to its users. Additional permissions should be obtained from the applicable author or publisher of the image. Full text @ Front Cell Dev Biol