FIGURE SUMMARY
Title

RNA exosome mutations in pontocerebellar hypoplasia alter ribosome biogenesis and p53 levels

Authors
Müller, J.S., Burns, D.T., Griffin, H., Wells, G.R., Zendah, R.A., Munro, B., Schneider, C., Horvath, R.
Source
Full text @ Life Sci Alliance

ZFIN is incorporating published figure images and captions as part of an ongoing project. Figures from some publications have not yet been curated, or are not available for display because of copyright restrictions.

EXPRESSION / LABELING:
Genes:
Fish:
Anatomical Term:
Stage: Day 5

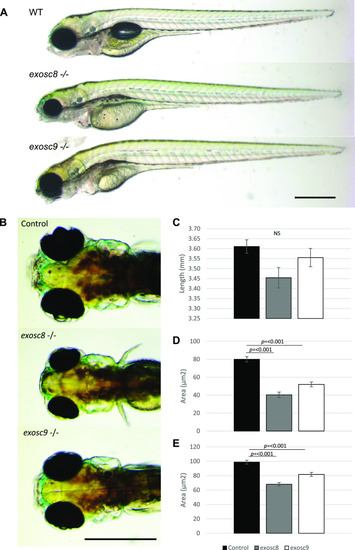
<italic>exosc8</italic> and <italic>exosc9</italic> homozygous mutant zebrafish develop microcephaly.

(A) Gross anatomy of 5-dpf wild-type, exosc8 homozygous mutant and exosc9 homozygous mutant zebrafish embryos; lateral view, anterior to the left. Scale bar: 500 μm. (B) Dorsal view of wild-type, exosc8 homozygous mutant and exosc9 homozygous mutant zebrafish embryos. Scale bar: 500 μm. (C, D, E) Standard length, (D) area of eyes, and (E) area of head in 5-dpf wild-type, exosc8 homozygous mutant and exosc9 homozygous mutant zebrafish embryos. 13 control, 8 exosc8 (c.26_27del), and 5 exosc9 (c.198_208del) homozygous larvae were measured for the quantification. Error bars represent the standard error (±SEM), and statistical analysis was performed using unpaired t tests (exosc8 versus wt and exosc9 versus wt, respectively). NS, not significant.

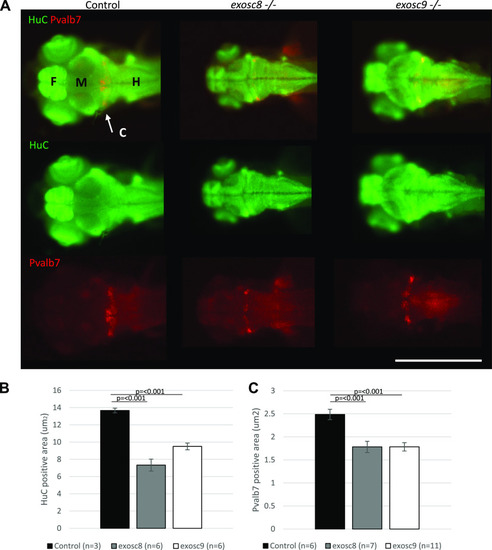
<italic>exosc8</italic> and <italic>exosc9</italic> homozygous mutant zebrafish develop cerebellar atrophy.

(A) Immunofluorescence in 5-dpf wild-type, exosc8 homozygous mutant and exosc9 homozygous mutant zebrafish embryos with antibodies raised against HuC (green) and Pvalb7 (red) Pvalb7 is a marker for Purkinje cells in the cerebellum, HuC is an early neuronal marker. Scale bar: 500 μm. (B, C) Quantification of (B) HuC-positive area and (C) Pvalb7-positive area in 5-dpf wild-type, exosc8 homozygous mutant and exosc9 homozygous mutant zebrafish embryos. Three control, six exosc8 (c.26_27del), and six exosc9 (c.198_208del) homozygous larvae were measured for the HuC quantification. 6 control, 7 exosc8 (c.26_27del), and 11 exosc9 (c.198_208del) homozygous larvae were measured for the Pvalb7 quantification. Error bars represent the standard error (±SEM) and statistical analysis was performed using unpaired t tests (exosc8 versus wt and exosc9 versus wt, respectively). Labelling: C, cerebellum; F, forebrain; H, hindbrain and spinal cord; M, midbrain.

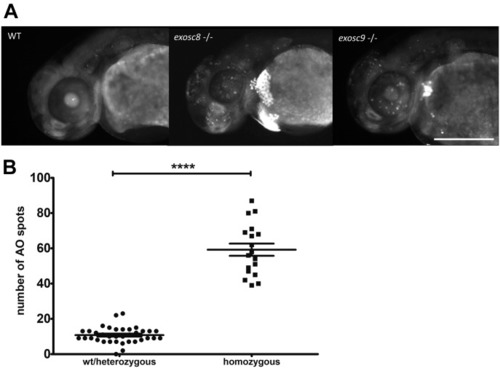
<italic>exosc8</italic> and <italic>exosc9</italic> homozygous mutant zebrafish have increased apoptosis.

(A) Acridine orange staining performed on 48-hpf wild-type, exosc8 homozygous mutant and exosc9 homozygous mutant zebrafish embryos. Representative images of each category are shown here. Four different clutches of offspring with 24 embryos each have been analysed; the acridine orange staining has been performed and evaluated first (without knowledge of the genotype), followed by genotyping of all embryos that were stained. Scale bar: 500 μm. (B) Quantification of acridine orange positive spots. Spots were counted in 36 images of wild-type or heterozygous embryos and 18 images of homozygous mutant embryos. Bright spots in the yolk sac were not counted. Error bars represent the standard error (±SEM) and statistical analysis was performed using the unpaired t test. ****P < 0.0001.

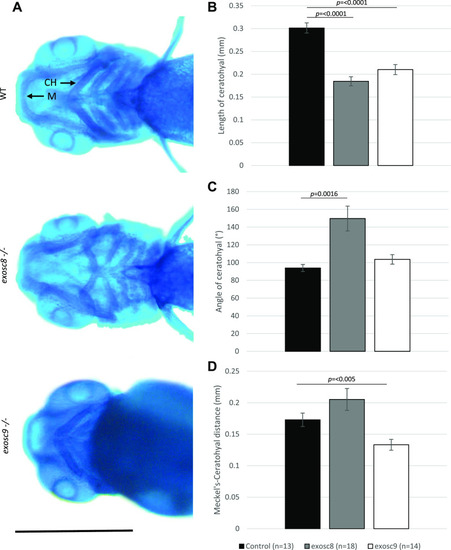
<italic>exosc8</italic> and <italic>exosc9</italic> homozygous mutant zebrafish develop craniofacial abnormalities.

(A) Alcian blue staining in 5-dpf wild-type, exosc8 homozygous mutant, and exosc9 homozygous mutant zebrafish embryos. Scale bar: 500 μm. (B, C, D) Length of ceratohyal, (C) angle of ceratohyal, and (D) distance from Meckel’s cartilage to the ceratohyal in exosc8 homozygous mutant and exosc9 homozygous mutant zebrafish embryos. (B, C, D) 13 control, 18 exosc8 (c.26_27del), and 14 exosc9 (c.198_208del) homozygous larvae were measured for the quantification in (B, C, D). Error bars represent the standard error (±SEM), and statistical analysis was performed using unpaired t tests (exosc8 versus wt and exosc9 versus wt, respectively). The difference between mutant and wt is not significant where no P-value is given. Abbreviations: CH, ceratohyal; M, Meckel’s cartilage.

PCR and sequencing of exosc8 and exosc9 in zebrafish.

(A) CRISPR/Cas9 was used to create a 2-bp deletion in exon 2 of exosc8. This would cause a frameshift and result in a premature stop codon and significantly truncated protein or degradation of the mRNA via nonsense-mediated decay. (B) CRISPR/Cas9 was used to create an 11-bp deletion in exon 3 of exosc9. This would cause a frameshift and result in a premature stop codon and significantly truncated protein or mRNA degradation via nonsense-mediated decay. (C) The 2-bp deletion generated in exosc8 could be identified by PCR of genomic DNA, followed by a restriction digest using TseI and then gel electrophoresis to genotype zebrafish. The wild-type allele remains uncut, whereas a new TseI restriction site appears in the mutant allele (GCAGC, TseI site is GCWGC). (D) The 11-bp deletion generated in exosc9 could be identified by PCR of genomic DNA, followed by gel electrophoresis to genotype zebrafish. The 11-bp difference between the wild -type band and the shorter mutant band can be visualised on a high percentage agarose gel. (E) RT-PCR for exosc9 in wild-type and exosc9 homozygous mutant fish reveals a reduction of exosc9 transcript in the mutants. The RT-PCR is not quantitative but shows a reduced band intensity in the exosc9 fish.

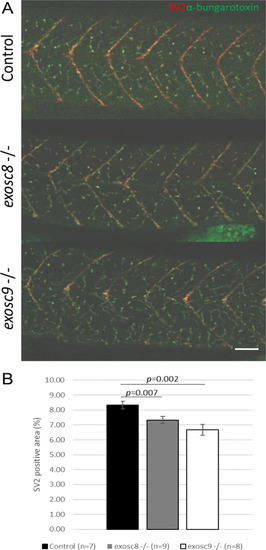
<italic>exosc8</italic> and <italic>exosc9</italic> homozygous mutant zebrafish have reduced motor neuron density.

(A) Immunofluorescence in 5-dpf wild-type, exosc8 homozygous mutant, and exosc9 homozygous mutant zebrafish larvae with an antibody raised against SV2 to stain presynaptic vesicles (red) and alpha bungarotoxin conjugated to Alexa Fluor 488 (green, staining postsynaptic acetylcholine receptors). (B) Quantification of the SV2-positive area in 5-dpf wild-type, exosc8 homozygous, mutant and exosc9 homozygous mutant zebrafish larvae. 5-dpf motor axons manage to migrate to neuromuscular junctions. However, there is significantly less motor axon branching in the exosc8 (c.26_27del) and exosc9 (c.198_208del) homozygous larvae than WT and heterozygous clutchmates. Seven control, nine exosc8 (c.26_27del), and 8 exosc9 (c.198_208del) homozygous larvae were measured for the quantification. Error bars represent the standard error (±SEM), and statistical analysis was performed using unpaired t tests (exosc8 versus wt and exosc9 versus wt, respectively). Scale bar: 50 μm.

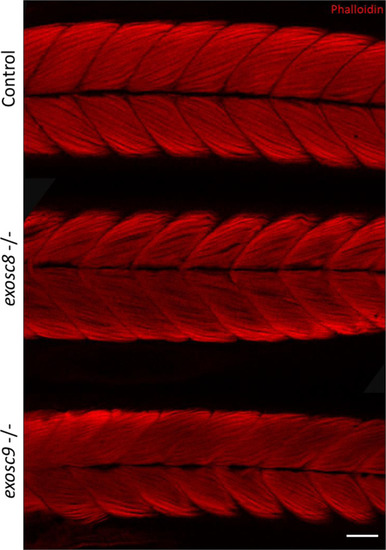
<italic>exosc8</italic> and <italic>exosc9</italic> homozygous mutant zebrafish develop muscular atrophy.

Immunofluorescence in 5-dpf wild-type, exosc8 homozygous mutant, and exosc9 homozygous mutant zebrafish larvae with phalloidin conjugated to Alexa Fluor 594. Phalloidin staining at 5 dpf showed that the exosc8 (c.26_27del) and exosc9 (c.198_208del) homozygous larvae appeared to have thinner tails than WT and heterozygous clutchmates (representative images shown here). Muscle fibres appeared disorganized and not straight with gaps between fibres in the exosc8 (c.26_27del) and exosc9 (c.198_208del) homozygous larvae compared with WT and heterozygous clutchmates. Scale bar: 50 μm.

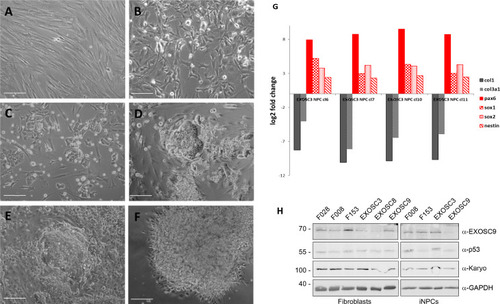
Example of conversion of fibroblasts to induced neuronal progenitor cells (iNPCs) and qPCR.

(A, B, C, D, E, F) Cell morphology at different stages of the direct conversion procedure. (A) Day 0 fibroblasts before infection with Sendai virus. (B) Day 2 after Sendai virus infection and switch to neural induction medium. (C) Day 9. (D) Day 16. (E) Day 21. (F) Day 29. All scale bars: 50 μm. (G) qPCR to characterise expression of fibroblast, stem cell, and neuronal markers in iNPC colonies; the cells shown in this example are the EXOSC3 iNPCs. Expression levels were normalised to GAPDH and the respective fibroblast line (here EXOSC3). The neural stem cell markers were Sox2, Sox1, nestin, and Pax6; the fibroblast markers were Col1a1 and Col3a1. (H) Protein levels of control and patient fibroblasts and iNPCs were also analysed by immunoblotting using antibodies specific for EXOSC9, p53, and karyopherin or GAPDH as loading controls.

Acknowledgments
This image is the copyrighted work of the attributed author or publisher, and ZFIN has permission only to display this image to its users. Additional permissions should be obtained from the applicable author or publisher of the image. Full text @ Life Sci Alliance