FIGURE SUMMARY
Title

Optic cup morphogenesis requires neural crest-mediated basement membrane assembly

Authors
Bryan, C.D., Casey, M.A., Pfeiffer, R.L., Jones, B.W., Kwan, K.M.
Source
Full text @ Development

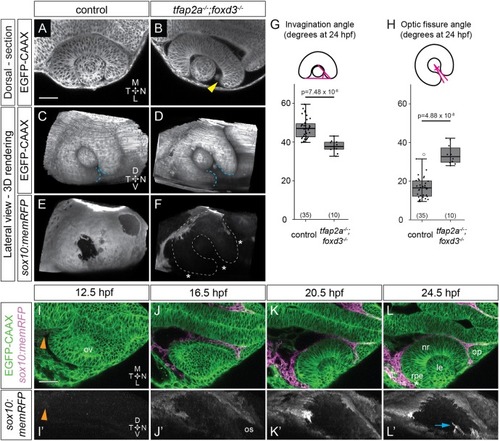
Optic cup morphogenesis requires neural crest. (A-F) Dorsal (A,B) and lateral (C-F) views of 24 hpf Tg(bactin2:EGFP-CAAX);Tg(sox10:memRFP) double-transgenic control and tfap2a;foxd3 mutant optic cups. A and B show single confocal sections at the dorsal-ventral midpoint of the lens. Arrowhead in B marks a gap where nasal retina fails to fully enwrap the lens. White dashed lines in F mark the optic cup boundaries. Blue dashed lines (C,D) mark the optic fissure margins. Asterisks in F indicate regions lacking neural crest. (G,H) Quantification of invagination angle (G) and optic fissure angle (H) measured as shown in inset diagrams. n (embryos) shown at base of graphs, from three experiments. P-values were calculated using one-way ANOVA with Tukey HSD post-hoc test. (I-L′) Time-lapse imaging (12.5-24.5 hpf) of a Tg(bactin2:EGFP-CAAX);Tg(sox10:memRFP) double-transgenic embryo. (I-L) Dorsal view, single confocal sections. (I′-L′) Lateral view, 3D rendering of magenta channel from same dataset. Arrowheads in I,I′ indicate RFP+ neural crest. Asterisk in L marks RPE between neural crest and neural retina. Arrow in L′ marks neural crest-derived cells entering the optic fissure. Scale bars: 50 μm. D, dorsal; L, lateral; le, lens; M, medial; N, nasal; nr, neural retina; op, olfactory placode; os, optic stalk; ov, optic vesicle; rpe, retinal pigment epithelium; T, temporal; V, ventral.

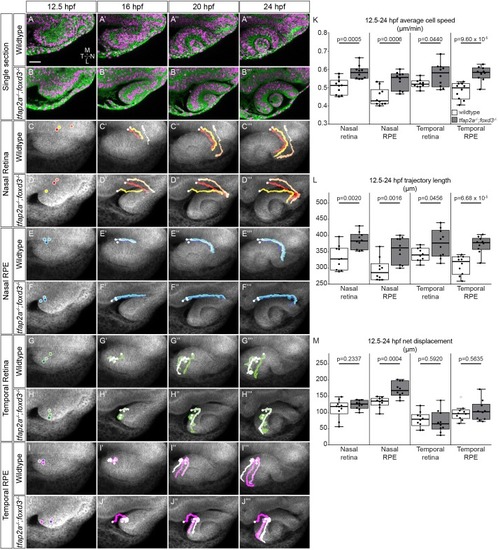
Optic cup cell movements are disrupted in tfap2a;foxd3 mutants. (A-J‴) Time-lapse imaging (12.5-24 hpf) of optic cup morphogenesis of wild-type and tfap2a;foxd3 mutant embryos. (A-B‴) Dorsal view, single confocal sections from wild-type (A-A‴) and tfap2a;foxd3 mutant (B-B‴) 4D datasets. EGFP-CAAX (green) labels cell membranes; H2A.F/Z-mCherry (magenta) labels nuclei. (C-J‴) Average projections of EGFP-CAAX channel (gray) with indicated nuclear trajectories overlaid. Trajectories were generated by accumulating nuclear selections over time. (K-M) Average 3D cell speed (K), total 3D trajectory length (L) and 3D net displacement (M) of cells contributing to each region at 24 hpf. n=10 cells from each region (two embryos/genotype, five cells each). P-values were calculated using Welch's t-test. Scale bar: 50 µm. L, lateral; M, medial; N, nasal; T, temporal.

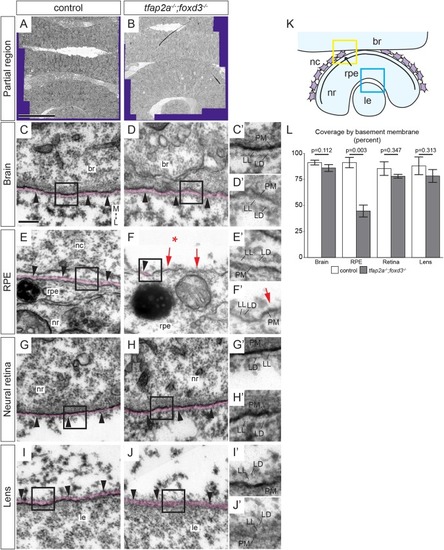
The basement membrane around the RPE is disrupted in tfap2a;foxd3 mutants. (A,B) Tiled arrays of 2 nm/pixel resolution transmission electron micrographs of eyes and forebrains of 24 hpf wild-type control (A) and tfap2a;foxd3 mutant (B) zebrafish. Acquired regions extend across the brain and through the opposite eye. Purple area is the boundary of captured images. (C-J′) Basement membranes around the brain, RPE, neural retina, and lens in control (C,E,G,I) and tfap2a;foxd3 mutant (D,F,H,J) embryos imaged at high resolution (∼0.5 nm/pixel). BMs are pseudocolored magenta, and black boxes are enlarged in C′-J′ to aid visualization. The BM around the RPE of tfap2a;foxd3 mutant embryos appears to be discontinuous (F,F′ red arrows) compared with wild type (E,E′); other BMs appear normal and continuous (black arrowheads). Asterisk in F indicates absence of neural crest. (K) Diagram of tissues imaged. Boxes indicate brain/neural crest/RPE (yellow) and neural retina/lens (blue) regions re-imaged at high resolution (∼0.5 nm/pixel). (L) Quantification of the percentage of tissue surface lined with discernable, continuous BM containing both lamina lucida and lamina densa. P-values were calculated using Welch's t-test; error bars represent ±2×s.e.m. Scale bars: 50 µm (A), 200 nm (C). Magnification: 10,000× (C-J); 20,000×(C′-J′). All images transverse sections, anterior views. br, brain; L, lateral; LD, lamina densa; le, lens; LL, lamina lucida; M, medial; nc, neural crest; nr, neural retina; PM, plasma membrane; rpe, retinal pigment epithelium.

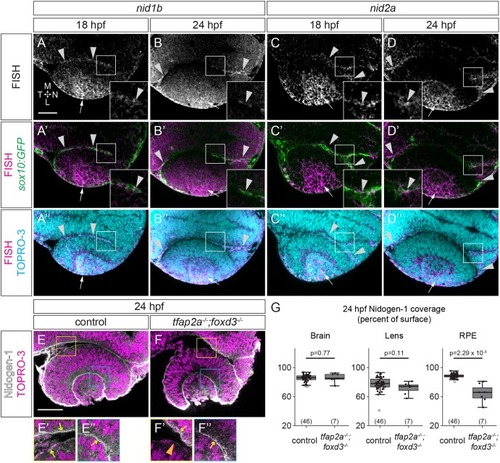
Nidogen mRNA and protein are expressed around the developing eye. (A-D″) Fluorescence in situ hybridization (FISH) for nid1b (A,B) and nid2a (C,D) in Tg(sox10:GFP) embryos. (A′-D′) FISH (magenta) merged with sox10:GFP expression (green) to visualize colocalization between FISH and GFP+ neural crest (arrowheads). (A″-D″) FISH merged with nuclei (TO-PRO-3, cyan). Arrows mark lens expression. (E-F″) Immunofluorescence for nidogen 1. In 24 hpf control embryos, nidogen 1 protein (grayscale) is detected along the brain and RPE (yellow box in E, arrows in E′) and lens-retina interface (blue box in E, arrow in E″). In 24 hpf tfap2a;foxd3 mutants, nidogen 1 is discontinuous around the RPE (F′, orange arrowhead), but still lines the brain (F′, arrow) and lens-retina interface (F″, arrow). (G) Measurements of nidogen 1 protein coverage around the brain, lens and RPE. Percentages were calculated by dividing the length of antibody labeling over the total tissue surface length. P-values calculated using Welch's t-test. n (embryos) shown at base of graphs. Scale bars: 50 µm. Dorsal view, single confocal sections. L, lateral; M, medial; N, nasal; T, temporal.

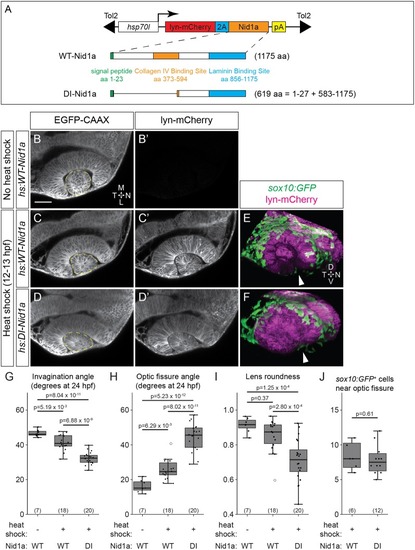
Dominant-interfering nidogen disrupts optic cup morphogenesis. (A) Schematics of full length (WT) and dominant-interfering (DI) zebrafish nidogen 1a and transgene constructs. (B-D′) Tg(bactin2:EGFP-CAAX) transgenics also carrying either hs:WT-Nid1a (B-C′) or hs:DI-Nid1a (D,D′) transgenes. Control embryos (B), not heat shocked, are lyn-mCherry (B′); experimental embryos were heat shocked at 12-13 hpf (C-D′). Dorsal view, single confocal sections. (E,F) Tg(sox10:GFP)+;hs:WT-Nid1a (E) or hs:DI-Nid1a (F) transgenics heat shocked at 12-13 hpf. GFP+ neural crest cells migrate around the optic cup and into the optic fissure (arrowheads) in both conditions. Lateral view, 3D renderings, 24 hpf. (G-J) Quantification of invagination angle (G), optic fissure angle (H), lens roundness (I) and sox10:GFP+ cell number at the optic fissure (J). Dashed lines in B-D mark lens outlines used for roundness measurements. sox10:GFP+ cells were counted as near the optic fissure if they were located in the optic fissure or were in contact with a margin of the optic fissure. n (embryos) shown at base of graphs, from one to three experiments. P-values were calculated using one-way ANOVA with Tukey HSD post-hoc test (G-I) or Welch's t-test (J). Scale bar: 50 μm. D, dorsal; L, lateral; M, medial; N, nasal; T, temporal; V, ventral.

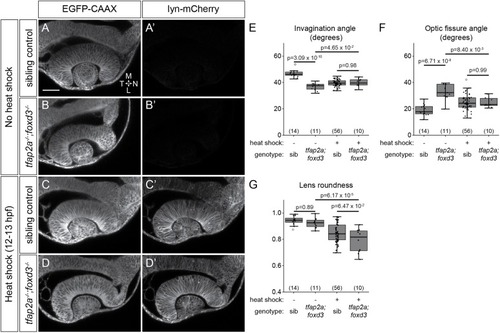
Nid1a overexpression partially rescues optic cup morphogenesis in tfap2a;foxd3 mutants. (A-D′) Double-transgenic embryos [Tg(bactin2:EGFP-CAAX);Tg(hs:WT-Nid1a)]: sibling control and tfap2a;foxd3 mutant embryos not heat shocked (A-B′), or heat shocked at 12-13 hpf (C-D′). Dorsal view, single confocal sections, 24 hpf. (E-G) Quantification of invagination angle (E), optic fissure angle (F) and lens roundness (G). n (embryos) shown in the base of the graph, from two or three experiments. P-values were calculated using one-way ANOVA with Tukey HSD post-hoc test. Scale bar: 50 μm. L, lateral; M, medial; N, nasal; T, temporal.

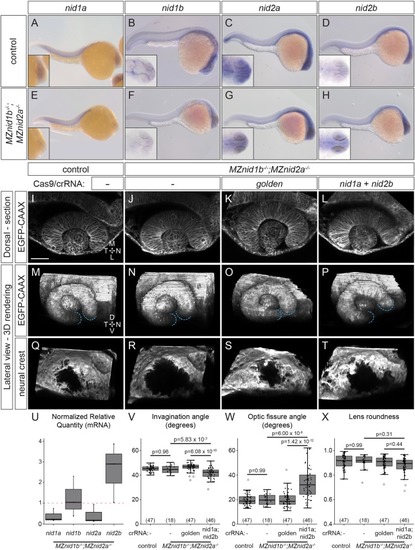
Nidogen is required for optic cup morphogenesis. (A-H) Whole-mount in situ hybridization for nidogens in 24 hpf control (A-D) and MZnid1b; MZnid2a mutant (E-H) embryos. Insets show magnified view of head. (I-T) Optic cup morphology and neural crest localization in EGFP-CAAX mRNA-injected, Tg(sox10:memRFP)+ embryos: control (I,M,Q), MZnid1b;MZnid2a mutant (J,N,R), golden crispant MZnid1b;MZnid2a mutant (K,O,S) and nid1a;nid2b crispant MZnid1b;MZnid2a mutant (L,P,T). (U) RT-qPCR quantification of nidogen transcripts in MZnid1b;MZnid2a mutant embryos, normalized to wild-type control expression levels (magenta dashed line, NRQ=1). Results from three biological replicates run in triplicate. (V-X) Quantification of invagination angle (V), optic fissure angle (W) and lens roundness (X). n (embryos) shown in base of graph. P-values were calculated using one-way ANOVA with Tukey HSD post-hoc test. Scale bar: 50 μm. D, dorsal; L, lateral; M, medial; N, nasal; T, temporal; V, ventral.

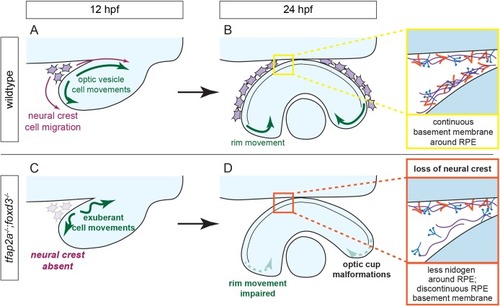
Model of optic cup morphogenesis in wild-type and tfap2a;foxd3 double-mutant zebrafish. (A,B) Optic cup morphogenesis in a wild-type embryo. Neural crest cells migrate around the optic vesicle and enable efficient movement of optic vesicle cells (A). Cells undergo rim movement and contribute to the neural retina, partially enabled by the presence of a continuous BM along the surface of the RPE (B). (C,D) Optic cup morphogenesis in a tfap2a;foxd3 double-mutant embryo. Most neural crest cells are absent, resulting in optic vesicle cells that move faster and farther than those in wild-type embryos (C). Rim movement is impaired in the absence of a complete, continuous BM around the RPE, resulting in optic cup malformations (D).

ZFIN is incorporating published figure images and captions as part of an ongoing project. Figures from some publications have not yet been curated, or are not available for display because of copyright restrictions.

ZFIN is incorporating published figure images and captions as part of an ongoing project. Figures from some publications have not yet been curated, or are not available for display because of copyright restrictions.

EXPRESSION / LABELING:
Antibodies:
Fish:
Anatomical Term:
Stage: Prim-5
PHENOTYPE:
Fish:
Observed In:
Stage: Prim-5

ZFIN is incorporating published figure images and captions as part of an ongoing project. Figures from some publications have not yet been curated, or are not available for display because of copyright restrictions.

EXPRESSION / LABELING:
Genes:
Fish:
Anatomical Terms:
Stage Range: 14-19 somites to Prim-5
Acknowledgments
This image is the copyrighted work of the attributed author or publisher, and ZFIN has permission only to display this image to its users. Additional permissions should be obtained from the applicable author or publisher of the image. Full text @ Development