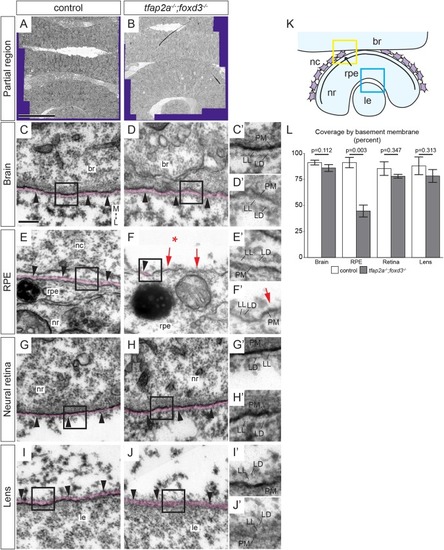
The basement membrane around the RPE is disrupted in tfap2a;foxd3 mutants. (A,B) Tiled arrays of 2 nm/pixel resolution transmission electron micrographs of eyes and forebrains of 24 hpf wild-type control (A) and tfap2a;foxd3 mutant (B) zebrafish. Acquired regions extend across the brain and through the opposite eye. Purple area is the boundary of captured images. (C-J′) Basement membranes around the brain, RPE, neural retina, and lens in control (C,E,G,I) and tfap2a;foxd3 mutant (D,F,H,J) embryos imaged at high resolution (∼0.5 nm/pixel). BMs are pseudocolored magenta, and black boxes are enlarged in C′-J′ to aid visualization. The BM around the RPE of tfap2a;foxd3 mutant embryos appears to be discontinuous (F,F′ red arrows) compared with wild type (E,E′); other BMs appear normal and continuous (black arrowheads). Asterisk in F indicates absence of neural crest. (K) Diagram of tissues imaged. Boxes indicate brain/neural crest/RPE (yellow) and neural retina/lens (blue) regions re-imaged at high resolution (∼0.5 nm/pixel). (L) Quantification of the percentage of tissue surface lined with discernable, continuous BM containing both lamina lucida and lamina densa. P-values were calculated using Welch's t-test; error bars represent ±2×s.e.m. Scale bars: 50 µm (A), 200 nm (C). Magnification: 10,000× (C-J); 20,000×(C′-J′). All images transverse sections, anterior views. br, brain; L, lateral; LD, lamina densa; le, lens; LL, lamina lucida; M, medial; nc, neural crest; nr, neural retina; PM, plasma membrane; rpe, retinal pigment epithelium.
|
