FIGURE SUMMARY
Title

Visualization of Mitochondrial Ca2+ Signals in Skeletal Muscle of Zebrafish Embryos with Bioluminescent Indicators

Authors
Vicente, M., Salgado-Almario, J., Soriano, J., Burgos, M., Domingo, B., Llopis, J.
Source
Full text @ Int. J. Mol. Sci.

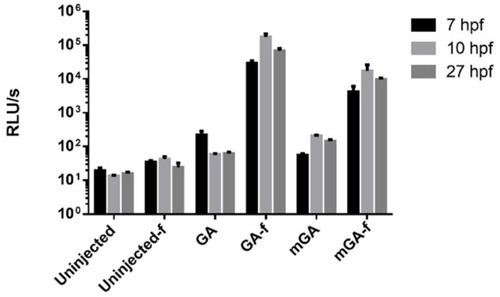
Expression of biosensors GFP-aequorin (GA) and mitoGA in zebrafish embryos. (A) Ubiquitous transient expression of GA and mitoGA in zebrafish at 12 and 28 hpf visualized with a fluorescence stereomicroscope. (B) Localization of GA and mitoGA expressed in the trunk musculature by confocal microscopy (28 hpf) and mitoGA in the enveloping layer (12 hpf). (C) MitoGA, but not GA, colocalizes with the mitochondrial marker TMRE in skeletal muscle at 28 hpf. (D) Colocalization of mitoGA with TMRE at 9 and 27 hpf in the cells of the enveloping layer of a zebrafish embryo. Mitochondrial import of mitoGA was complete at 27 hpf. The scale bars represent 200 µm (A), 20 µm (B,C) and 5 µm (D).

Aequorin reconstitution of GA and mitoGA (mGA) with f-coelenterazine assessed by luminometry in single embryos at 7, 10 and 27 hpf. Note the logarithmic scale. Shown as mean ± SEM (n = 6 embryos for each condition). The reconstituted GA-f and mGA-f were statistically different from all controls according to a one-way ANOVA test. RLU, relative luminescence units.

Continuous luminescence imaging of spontaneous Ca2+ transients in the trunk of zebrafish from 12 to 28 hpf. (A) Home-made low light microscope with EMCCD camera. (B) Representative experiments showing two periods of increased Ca2+ signaling, SP1 and SP2, in the cytoplasm and in mitochondria. Note the different luminescence scales. The images next to the graphs show the accumulated luminescence from 12 to 28 hpf. (C) Bioluminescence traces (100 s) corresponding to SP1 and SP2 in the cytoplasm (top graphs) and mitochondria (bottom graphs). The images on the right show one Ca2+ spike in the cytoplasm (top) and mitochondria (bottom) during the SP2 period. Images were acquired at 1 Hz. The scale bar represents 200 µm. The color scale indicates RLU.

Frequency of spontaneous contractions and Ca2+ transients in the trunk of zebrafish embryos (24–28 hpf). (A) Representative experiments showing contractions (measured by transmission light, upper panels) and Ca2+ transients (measured by bioluminescence, lower panels) in the same embryo expressing GA (left) or mitoGA (right). (B) Comparison between the average frequency of contractions observed by transmitted light (imaging at 4.2 Hz) and Ca2+ transients (imaging at 4.7 Hz) in the cytoplasm (GA, left) and mitochondria (mitoGA, right). A two-tailed paired t-test was used. Shown as mean ± SEM (n = 6 embryos).

Effect of inhibiting mitochondrial Ca2+ uptake on the frequency of contractions and Ca2+ transients in 24–28 hpf embryos. Effect of the uncoupler FCCP (1 µM) and the MCU inhibitor DS16570511 (100 µM) on the frequency of skeletal muscle contractions in the trunk in non-injected embryos (A), and on cytosolic (B), and mitochondrial (C) Ca2+ transients. In (B) and (C) the frequency and amplitude of Ca2+ transients are shown. A two-tailed paired t-test was used. Shown as mean ± SEM (n = 5 to 13 embryos). The graphs on the right are representative experiments. Statistical significance was considered for * p < 0.05, *** p < 0.001, **** p < 0.0001.

Kinetics of spontaneous Ca2+ transients in the trunk and tail in 28 hpf zebrafish embryos. (A) Representative experiment of an embryo expressing Twitch-4, imaged at 33 Hz. Left panels, transmitted light image and fluorescence FRET and donor images (cpCit174 and ECFP, respectively). Right panels, emission ratio of Twitch-4 fluorescence (FRET acceptor/donor) in pseudocolor, at rest and during the peak of a Ca2+ transient. The calibration square shows 100 µm, hue codes for emission ratio, and intensity codes for fluorescence. A region of interest (ROI, red trace) comprising somites 6–11 was used for quantification of FRET channel fluorescence (Ai), donor channel fluorescence (Aii) and fluorescence emission ratio (Aiii) during the Ca2+ transient. The black arrowheads indicate a motion artifact. (B) Transmitted light image and luminescence image during a Ca2+ spike in a GA expressing embryo. A ROI (green trace) was used for quantification of bioluminescence. (Bi) shows the Ca2+ transient measured in the ROI drawn in (B). The scale bar represents 100 µm. The color scale indicates RLU. (C) Comparison of the kinetic parameters of cytoplasmic Ca2+ transients measured with GA (bioluminescence imaged at 11.9 Hz, green points) and Twitch-4 (fluorescence acquired at 33 Hz, red points) in somites 6–11. A two-tailed unpaired t-test was used. Shown as mean ± S.D. (n = 128 transients from 3 embryos for GA; n = 25 transients from 4 embryos for Twitch-4). Statistical significance was considered for **** p < 0.0001.

Comparison of the kinetic parameters of cytosolic and mitochondrial Ca2+ transients in zebrafish trunk in embryos expressing GA and mitoGA. Ca2+ transients in cytoplasm and mitochondria were compared. Embryos were imaged at 11.9 Hz. A two-tailed unpaired t-test was used. Shown as mean ± S.D. (n = 128 transients from 3 embryos for GA, green points; n = 71 transients from three embryos for mitoGA, black points). Statistical significance was considered for * p < 0.05.

Propagation of Ca2+ transients along the trunk and tail in embryos expressing Twitch-4 and GA. (A) Transmitted light and emission ratio at rest and during a Ca2+ transient in a Twitch-4 expressing embryo at 28 hpf. The calibration square shows 100 µm, hue codes for emission ratio, and intensity codes for fluorescence. Fluorescence images were acquired at 33 Hz. ROIs were drawn over somites in groups of 3 (colored traces). The graph shows the time course of a Ca2+ transient in the indicated color-coded ROIs. (B) Snapshots of a Ca2+ transient in a GA-expressing embryo with luminescence overlaid on transmitted light images. ROIs were selected on the indicated somites in the left panel in groups of three (colored traces). Images were acquired at 11.9 Hz. The scale bar represents 100 µm. The color scale indicates RLU. The graph shows the time course of luminescence during two contractions on the indicated somites. The snapshots on the left correspond to the first contraction (*).

Acknowledgments
This image is the copyrighted work of the attributed author or publisher, and ZFIN has permission only to display this image to its users. Additional permissions should be obtained from the applicable author or publisher of the image. Full text @ Int. J. Mol. Sci.