FIGURE SUMMARY
Title

C3orf70 Is Involved in Neural and Neurobehavioral Development

Authors
Ashikawa, Y., Shiromizu, T., Miura, K., Adachi, Y., Matsui, T., Bessho, Y., Tanaka, T., Nishimura, Y.
Source
Full text @ Pharmaceuticals (Basel)

Venn diagrams of the number of differentially expressed genes regulated by Neurog1/2 and Ascl1. Transcriptome data of stem cells with and without overexpression of Neurog1/2 (GSE60548) or Ascl1 (GSE43971) were downloaded from a public database. Genes differentially expressed in stem cells on days 1, 3, and 4 post-induction of Neurog1/2 overexpression versus control cells, or on days 3 and 7 post-induction of Ascl1 overexpression versus control cells were identified using a false discovery rate threshold of 10%. The number of genes increased (A) and decreased (B) by Neurog1/2 or Ascl1 in each group and the overlap between groups are shown.

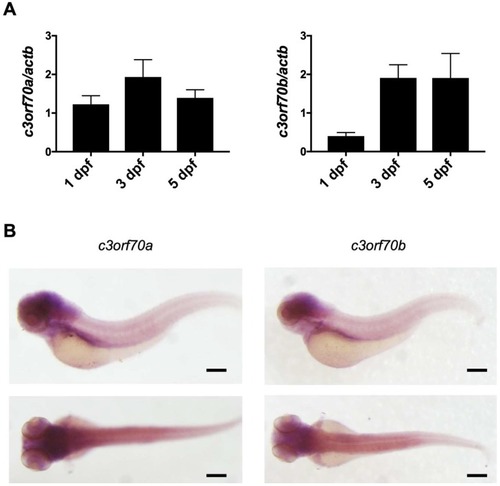
Expression of c3orf70a and c3orf70b in zebrafish. (A) qPCR analysis of c3orf70a and c3orf70b expression in zebrafish at 1, 3, and 5 dpf. Data are presented as the mean ± SEM of n = 3 relative to actb mRNA. (B) Whole-mount in situ hybridization of c3orf70a and c3orf70b expression in zebrafish at 3 dpf. Representative images of the lateral and dorsal views are shown. Scale bars, 200 μm.

EXPRESSION / LABELING:
Genes:
Fish:
Anatomical Terms:
Stage Range: Prim-5 to Day 5

Generation of c3orf70-KO zebrafish. (A) Heteroduplex mobility assay of PCR products after amplification of the crRNA-targeted genomic region of c3orf70a and c3orf70b. Genomic DNA was extracted from c3orf70 wild-type (WT) and c3orf70-KO zebrafish and subjected to PCR to amplify short fragments of the c3orf70a and c3orf70b genes, including their crRNA target sites. The PCR products were electrophoresed in a 10% acrylamide gel. The positions of the expected homoduplexes for WT and KO zebrafish are indicated by black and red arrowheads, respectively. (B) Nucleotide sequence alignment of c3orf70a and c3orf70b genes from WT and KO zebrafish. The recognition sites of crRNA targeting c3orf70a and c3orf70b, including the PAM sequences, are shown in magenta and red boxes, respectively. (C) Alignment of amino acid sequences inferred from cDNA of c3orf70a and c3orf70b from WT and KO zebrafish.

Impaired neuronal marker expression in c3orf70-KO zebrafish. (AD) Whole-mount in situ hybridization (A,B) and qPCR (C,D) of neurod1 (A,C) and elavl3 (B,D) expression in c3orf70 WT and KO zebrafish at 2 dpf. Data are presented as the mean ± SEM of n = 4 for both WT and KO. (E,F) Representative images (E) and quantification of fluorescence (F) in Tg (eno2: Cerulean) c3orf70-WT or KO zebrafish at 5 dpf. Data are presented as the mean ± SEM of n = 60 and 62 for WT and KO groups, respectively.

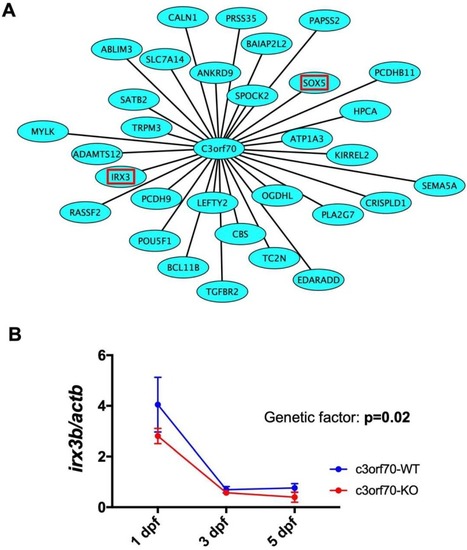
Weighted gene coexpression network analysis (WGCNA) identifies IRX3 as a gene coexpressed with C3orf70 during neurogenesis. (A) Schematic showing the 31 genes coexpressed with C3orf70 in human stem cells overexpressing Neurog1/2 (GSE60548) [13] and mouse stem cells overexpressing Ascl1 (GSE43971) [12], as identified by WGCNA. IRX3 and SOX5 are outlined in red. (B) qPCR analysis of irx3b expression in c3orf70-WT and KO zebrafish. Data are presented as the mean ± SEM of n = 3.

Impaired circadian behavior in c3orf70-KO zebrafish. (A) Overview of the circadian behavioral analysis. Behavior was assessed on 7 to 8 dpf using four endpoints: distance moved (B,F), cumulative duration at high mobility (C,G) and medium mobility (D,H), and cumulative duration in the center zone (E,I). Behavior during the dark and light periods is shown in (BE) and (FI), respectively. Data are presented as the mean ± SEM of n = 40 for WT and n = 41 for KO.

Impaired behavioral responses to light–dark cycling in c3orf70-KO zebrafish. (A) Overview of the behavioral analysis of the response to 3-min cycling between light and dark conditions. Behavior in c3orf70-WT or KO was assessed as: distance moved (B,F), cumulative duration at high mobility (C,G) and medium mobility (D,H), and cumulative duration in the center zone (E,I). Behavior during dark and light periods is shown in (BE) and (FI), respectively. Data are presented as the mean ± SEM of n = 40 for WT and n = 41 for KO.

Unillustrated author statements

Acknowledgments
This image is the copyrighted work of the attributed author or publisher, and ZFIN has permission only to display this image to its users. Additional permissions should be obtained from the applicable author or publisher of the image. Full text @ Pharmaceuticals (Basel)