IMAGE

Figure 4

ID
ZDB-IMAGE-200125-79
Genes
Source
Figures for Ashikawa et al., 2019
Image
Figure Caption

Figure 4

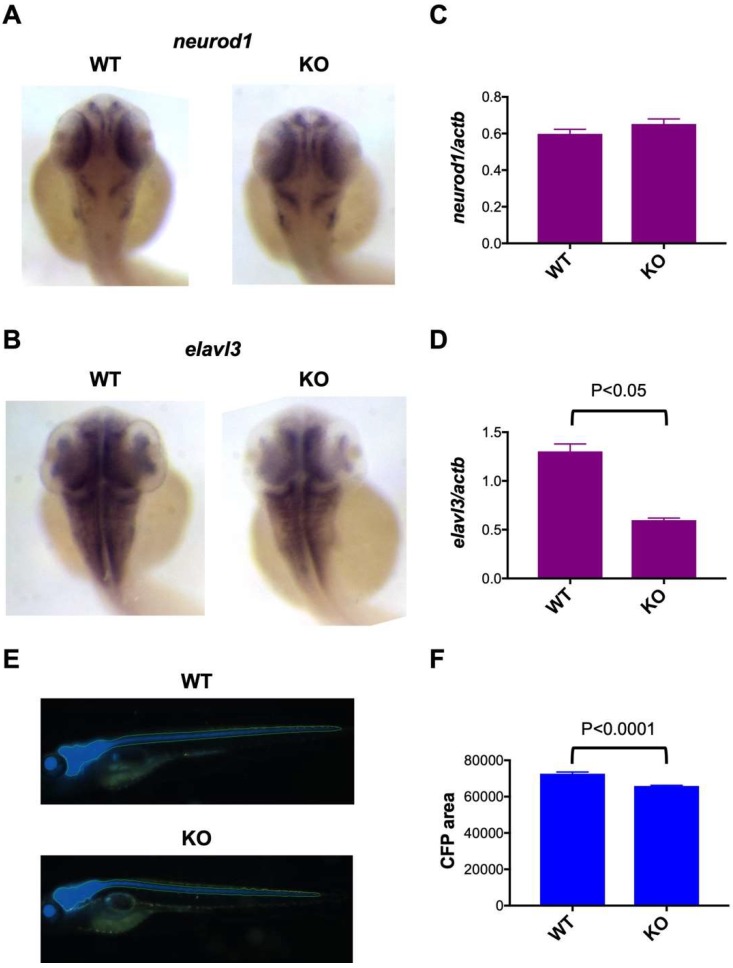
Impaired neuronal marker expression in c3orf70-KO zebrafish. (AD) Whole-mount in situ hybridization (A,B) and qPCR (C,D) of neurod1 (A,C) and elavl3 (B,D) expression in c3orf70 WT and KO zebrafish at 2 dpf. Data are presented as the mean ± SEM of n = 4 for both WT and KO. (E,F) Representative images (E) and quantification of fluorescence (F) in Tg (eno2: Cerulean) c3orf70-WT or KO zebrafish at 5 dpf. Data are presented as the mean ± SEM of n = 60 and 62 for WT and KO groups, respectively.

Figure Data
Acknowledgments
This image is the copyrighted work of the attributed author or publisher, and ZFIN has permission only to display this image to its users. Additional permissions should be obtained from the applicable author or publisher of the image. Full text @ Pharmaceuticals (Basel)