FIGURE SUMMARY
Title

Heterogeneous beta-catenin activation is sufficient to cause hepatocellular carcinoma in zebrafish

Authors
Kalasekar, S.M., Kotiyal, S., Conley, C., Phan, C., Young, A., Evason, K.J.
Source
Full text @ Biol. Open

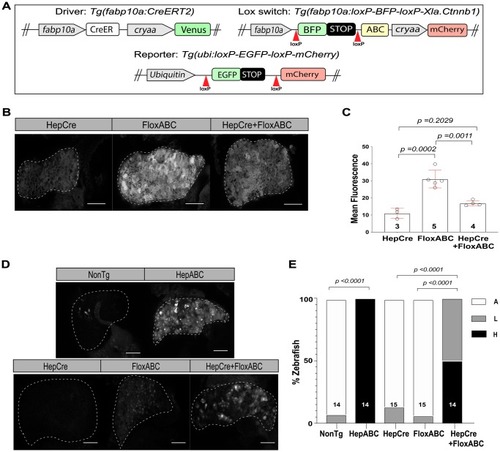
CreLox system enables switching on activated β-catenin. (A) Schematics of DNA constructs used in this study. Grey boxes indicate promoters; red arrowheads indicate loxP sites. ABC, Activated β-catenin. (B,C) Switching in Tg(fabp10a:Cre) (HepCre),Tg(fabp10a:flox-pt-β-cat) (FloxABC) and Tg(fabp10a:Cre); Tg(fabp10a:flox-pt-β-cat) (HepCre+FloxABC) larvae imaged at 5 dpf for BFP expression, detected by immunofluorescence using an anti-GFP antibody. Successful switching is indicated by loss of BFP expression. (B) Representative images. Livers are outlined. Scale bars: 50 µm. (C) Scatter plot with bar graph quantifying switching in terms of mean intensity of GFP fluorescence, ±standard deviation (s.d.). P-values derived using Sidak's multiple comparisons test following ordinary one-way ANOVA. N values are shown above x axis. Experiment was performed three times, with similar results each time, and representative results are shown. (D,E) Wnt reporter activity in Tg(fabp10a:Cre) (HepCre),Tg(fabp10a:flox-pt-β-cat) (FloxABC) and Tg(fabp10a:Cre); Tg(fabp10a:flox-pt-β-cat) (HepCre+FloxABC) siblings imaged at 5 dpf alongside Tg(fabp10a:pt-β-cat) (HepABC) and non-transgenic siblings (NonTg). All zebrafish contain 7xTCF-Xla.Siam:mCherry transgene for visualization of Wnt reporter activity by immunofluorescence. (D) Representative images of Wnt reporter activity (7xTCF-Xla.Siam:mCherry). Livers are outlined. Scale bars: 50 µm. (E) Stacked bar graphs showing percent of zebrafish with absent (A), low (L, involving <10% of hepatocytes) or high (H, involving >10% of hepatocytes) Wnt reporter activity. P-values derived using Fisher's exact test. N values are shown above x axis. Three experiments were pooled.

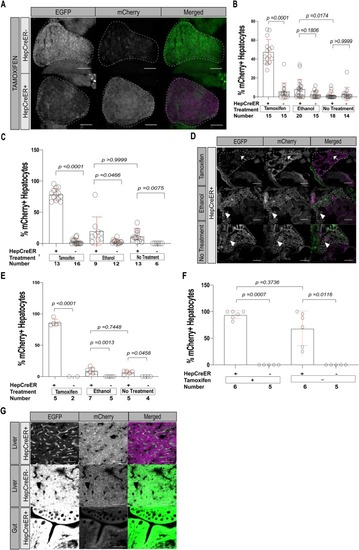
Analysis of Tg(ubi:switch) larvae shows fabp10a:CreERT2 leads to significant switching by 10 dpf even in the absence of tamoxifen treatment. (A,B) Switching in Tg(ubi:switch) zebrafish without (HepCreER−) and with (HepCreER+) the fabp10a:CreERT2 transgene, incubated with 4-hydroxytamoxifen (tamoxifen), ethanol, or egg water alone (no treatment) from 3 to 6 dpf and imaged at 6 dpf for EGFP and mCherry expression. Successful switching is indicated by loss of EGFP and gain of mCherry expression. (A) Representative images. Scale bars: 50 µm. Livers are outlined. (B) Scatter plot with bar graph quantifying switching in terms of ratio of hepatocytes that switched (mCherry+) relative to the total number of hepatocytes, ±s.d. P-values derived using Kruskal–Wallis non-parametric ANOVA followed by Dunn's multiple comparisons test. Graph shows combined data from two experiments. (C,D) Quantification of switching at 10 dpf in Tg(fabp10a:CreERT2);Tg(ubi:switch) (HepCreER+) and Tg(ubi:switch) (HepCreER−) larvae, incubated with tamoxifen, ethanol, or no treatment from 3 to 6 dpf. (C) Scatter plot with bar graph showing percentage of hepatocytes that switched (mCherry+) relative to the total number of hepatocytes, ±s.d. P-values obtained using Kruskal–Wallis non-parametric ANOVA followed by Dunn's multiple comparisons test. Graph represents combined data values from three experiments. (D) Representative images of HepCreER+ larvae. In TAM-treated zebrafish (top panels), most hepatocytes show switching (loss of EGFP and gain of mCherry expression); arrows indicate hepatocytes without switching. HepCreER+ zebrafish not treated with TAM (middle and bottom panels) show occasional cells with switching (arrowheads). Livers are outlined. Scale bars: 50 µm. (E) Quantification of switching at 20 dpf in HepCreER+ and HepCreER− larvae, incubated with tamoxifen, ethanol, or no treatment from 3 to 6 dpf. Scatter plot with bar graph shows percentage of hepatocytes that switched (mCherry+) relative to the total number of hepatocytes, ±s.d. P-values obtained using Sidak's multiple comparisons test following ordinary one-way ANOVA. This experiment was performed once. (F,G) Quantification of switching in adult (3 mpf) HepCreER+ and HepCreER− zebrafish, incubated with tamoxifen, ethanol, or no treatment from 3 to 6 dpf. (F) Scatter plot with bar graph shows the percentage of hepatocytes that switched (mCherry+) relative to the total number of hepatocytes, ±s.d. Graph represents combined data values from two experiments. P-values obtained using non-parametric Kruskal–Wallis test followed by Dunn's multiple comparisons test. (G) Representative images of liver (top and middle panels) or gut (bottom panel) cryosections showing complete switching (top panel) or no switching (middle and bottom panels). Scale bars: 40 µm.

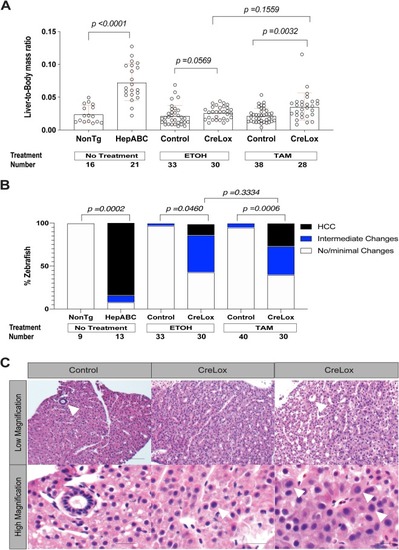
Switching on activated β-catenin (ABC) in larval zebrafish results in hepatocellular carcinoma (HCC) in adult zebrafish. CreLox [Tg(fabp10a:CreERT2); Tg(fabp10a:flox-pt-β-cat)] zebrafish and control siblings lacking either the Cre driver or lox-switch transgene [Tg(fabp10a:flox-pt-β-cat) and Tg(fabp10a:CreERT2), control], were treated with 4-hydroxytamoxifen (TAM) or vehicle control (ethanol, EtOH) from 3 to 6 dpf. Livers were weighed and examined microscopically 6 months later alongside livers from non-transgenic (NonTg) and Tg(fabp10a:pt-β-cat) (HepABC) zebrafish. Data were pooled from two experiments for NonTg and HepABC groups and from five experiments for control and CreLox groups treated with ETOH or TAM. (A) Scatter plot showing liver mass normalized to total body mass, ±s.d. P-values derived from Kruskal–Wallis non-parametric ANOVA followed by Dunn's multiple comparisons test. (B) Stacked bar graph showing the percentage of zebrafish per tested group categorized as no/minimal changes, intermediate changes, or HCC. P-values derived using Fisher's exact test comparing samples with and without HCC. (C) Representative H&E stained histological images from TAM-treated zebrafish. Left panels: control liver showing normal architecture with scattered bile ducts (arrowhead, top panel) and round, smooth, similarly sized nuclei (bottom panel); it was scored as no/minimal changes. Middle panels: CreLox liver showing minimal architectural abnormalities (top panel) and mild cytologic abnormalities including focal nuclear enlargement (arrowhead, bottom panel); it was scored as intermediate changes. Right panels: CreLox liver with moderate architectural abnormalities including pseudoglands (arrowhead, top panel) and moderate cytologic abnormalities including enlarged irregularly shaped nuclei (arrowheads, bottom panel); it was scored as HCC. Scale bars: 20 µm (top panels) and 10 µm (bottom panels).

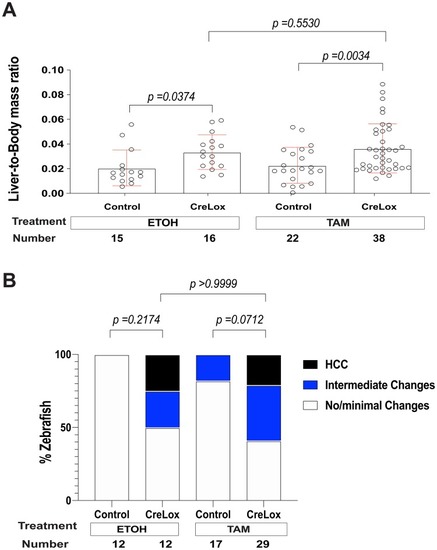
Switching on additional activated β-catenin in adult zebrafish does not increase HCC penetrance. CreLox [Tg(fabp10a:CreERT2); Tg(fabp10a:flox-pt-β-cat)] zebrafish and control siblings lacking either the Cre driver or lox-switch transgene [Tg(fabp10a:flox-pt-β-cat) and Tg(fabp10a:CreERT2), control], were treated with 4-hydroxytamoxifen (TAM) or vehicle (ethanol, EtOH) at 3 mpf. Livers were weighed and examined microscopically 6 months later. (A) Scatter plot showing liver mass normalized to total body mass, ±s.d. P-values were obtained using ordinary one-way ANOVA followed by Sidak's multiple comparisons test. Data from four experiments were pooled. (B) Stacked bar graph showing the percentage of zebrafish per tested group categorized as no/minimal changes, intermediate changes, or HCC. P-values derived using Fisher's exact test, comparing samples with and without HCC. Data from three experiments were pooled.

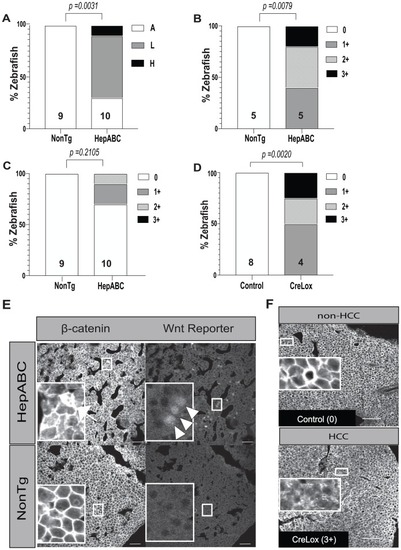
Heterogeneous Wnt reporter expression and β-catenin cytoplasmic localization in adult β-catenin-driven HCC. (A) Stacked bar graph showing analysis of Wnt reporter (7xTCF-Xla.Siam:mCherry) expression in liver tissue of Tg(fabp10a:flox-pt-β-cat) (HepABC) HCC and zebrafish livers of sibling controls lacking this transgene (NonTg). Wnt reporter expression was scored as: A, absent (no mCherry expression); L, low (mCherry expression in less than 10% of cells); or H, high (mCherry expression in greater than 10% of cells). P-values derived from Fisher's exact test comparing samples with (low or high) and without (absent) Wnt reporter expression. Graph shows data from one experiment. (B,C) Stacked bar graphs showing quantification of β-catenin localization by immunofluorescence staining performed on paraffin-embedded sections (B) or cryosections (C) in HepABC HCC and NonTg zebrafish livers. Samples were scored based on amount of cytoplasmic staining: 0, no cytoplasmic staining; 1+, focal (<10%) weak to moderate cytoplasmic staining; 2+, focal strong cytoplasmic staining or patchy (10–50%) weak to moderate cytoplasmic staining; 3+, diffuse (>50%) cytoplasmic staining. P-values derived from Fisher's exact test comparing samples with membrane staining only (0+) to those with cytoplasmic staining (1+ to 3+). Each experiment was performed once. (D) Stacked bar graph showing quantification of β-catenin localization in 6-mpf CreLox zebrafish with HCC and control siblings without HCC lacking either the Cre driver or lox-switch transgene [Tg(fabp10a:flox-pt-β-cat) and Tg(fabp10a:CreERT2), control]. Numbers above x axis indicate the sample size for each group. P-values determined by Fisher's exact test. Experiment was performed once. (E) Representative β-catenin and Wnt reporter images of cryosections from a HepABC liver diagnosed as HCC (top panels) and a NonTg liver diagnosed as no/minimal changes (bottom panels). Arrow indicates a cell with cytoplasmic β-catenin localization; white arrowheads indicate Wnt reporter expression. Scale bars: 30 µm. Insets contain 5× magnified images of regions of tissue in smaller boxes for each image. (F) Representative immunofluorescence images of β-catenin staining. Control zebrafish showed membrane staining only, whereas CreLox zebrafish with HCC showed varying degrees of cytoplasmic staining. Scale bars: 50 µm. In each image, large inset box is 5× magnification of small box.

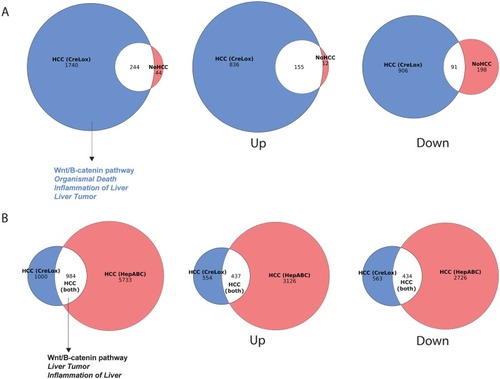
Bulk RNA sequencing demonstrates similarities in β-catenin-driven HCC models. (A) Venn diagrams showing the overlap of genes significantly dysregulated in livers from CreLox zebrafish with HCC and sibling CreLox zebrafish with no HCC. Overlap in all genes (left panel), upregulated genes (middle panel), and downregulated genes (right panel) are shown. Left panel also shows pathways unique to CreLox zebrafish with HCC, as determined by Ingenuity Pathway Analysis. Regular text indicates pathways curated under Canonical Pathways and italicized text indicates pathways curated under Diseases and Functions. (B) Venn diagrams showing the overlap of genes significantly dysregulated in CreLox HCC and HepABC HCC. Overlap in all genes (left panel), upregulated genes (middle panel), and downregulated genes (right panel) are shown. Left panel also shows pathways shared between CreLox HCC and HepABC HCC, as determined by Ingenuity Pathway Analysis. Regular text indicates pathways curated under Canonical Pathways and italicized text indicates pathways curated under Diseases and Functions.

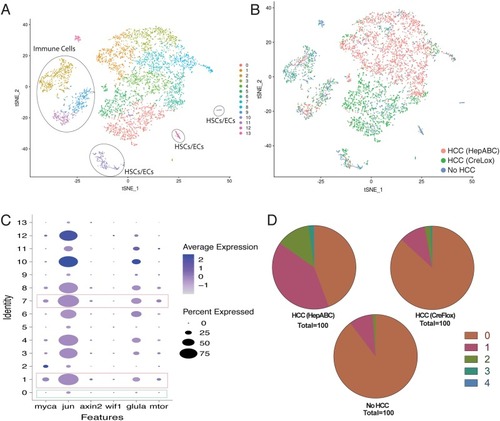
Single-cell RNA sequencing shows heterogeneous transcriptional profiles in β-catenin-driven HCC. (A) t-SNE plot of cells from all three samples [HCC from CreLox and Tg(fabp10a:pt-β-cat) zebrafish and non-HCC control liver] following multi-sample integration, color-coded by their associated cluster (0–13). Cell types of each cluster were determined based on differential expression of genes highlighted in Table S22: hepatocytes (non-circled cells), clusters 0, 1, 3, 4, 5, 6, 7, 8; immune cells, clusters 2, 9 and 11; hepatic stellate cells/endothelial cells, clusters 10 and 12; erythrocytes, cluster 13. (B) tSNE plot of multi-sample integration of cells from all three samples, color-coded by their sample of origin: Tg(fabp10a:pt-β-cat) (HepABC) HCC, pink; CreLox HCC, green; and no HCC control, blue. (C) Dot plot of β-catenin target genes differentially expressed across clusters 0–13 from A. Dot size represents the percentage of cells within the cluster that contribute to expression, and color intensity represents the average normalized level of gene expression. Pink rectangles highlight clusters with the lowest relative number of hepatocytes from non-HCC liver (clusters 1 and 7, Table S9), and green rectangles highlight clusters with the highest relative number of hepatocytes from non-HCC liver (cluster 0, Table S9). (D) Pie graphs showing the percent of hepatocytes in each liver (Table S16) that expressed 0 (brown), 1 (pink), 2 (green), 3 (teal), or 4 (blue) of Wnt/β-catenin target genes axin2, mtor, glula, myca and wif1.

Acknowledgments
This image is the copyrighted work of the attributed author or publisher, and ZFIN has permission only to display this image to its users. Additional permissions should be obtained from the applicable author or publisher of the image. Full text @ Biol. Open