IMAGE

Fig. 6.

ID
ZDB-IMAGE-191230-587
Source
Figures for Kalasekar et al., 2019
Image
Figure Caption

Fig. 6.

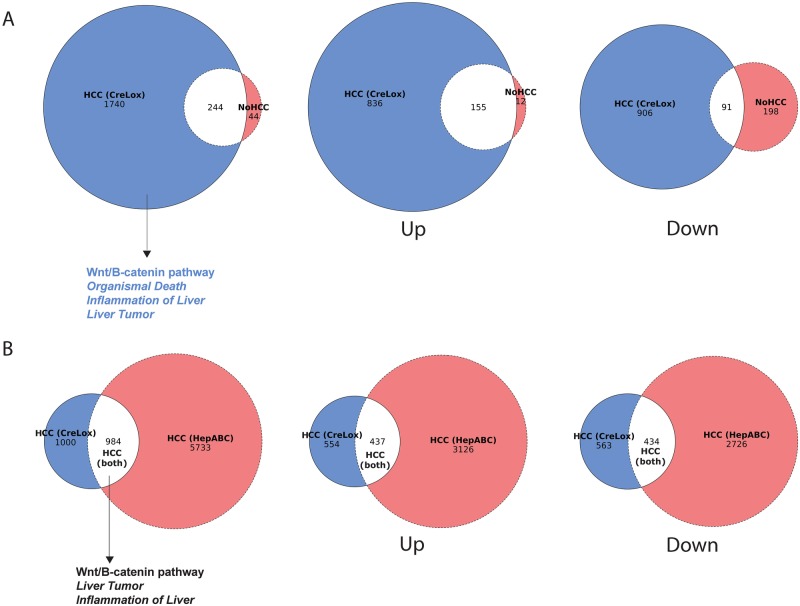
Bulk RNA sequencing demonstrates similarities in β-catenin-driven HCC models. (A) Venn diagrams showing the overlap of genes significantly dysregulated in livers from CreLox zebrafish with HCC and sibling CreLox zebrafish with no HCC. Overlap in all genes (left panel), upregulated genes (middle panel), and downregulated genes (right panel) are shown. Left panel also shows pathways unique to CreLox zebrafish with HCC, as determined by Ingenuity Pathway Analysis. Regular text indicates pathways curated under Canonical Pathways and italicized text indicates pathways curated under Diseases and Functions. (B) Venn diagrams showing the overlap of genes significantly dysregulated in CreLox HCC and HepABC HCC. Overlap in all genes (left panel), upregulated genes (middle panel), and downregulated genes (right panel) are shown. Left panel also shows pathways shared between CreLox HCC and HepABC HCC, as determined by Ingenuity Pathway Analysis. Regular text indicates pathways curated under Canonical Pathways and italicized text indicates pathways curated under Diseases and Functions.

Acknowledgments
This image is the copyrighted work of the attributed author or publisher, and ZFIN has permission only to display this image to its users. Additional permissions should be obtained from the applicable author or publisher of the image. Full text @ Biol. Open