FIGURE SUMMARY
Title

Robo2 regulates synaptic oxytocin content by affecting actin dynamics

Authors
Anbalagan, S., Blechman, J., Gliksberg, M., Gordon, L., Rotkopf, R., Dadosh, T., Shimoni, E., Levkowitz, G.
Source
Full text @ Elife

ZFIN is incorporating published figure images and captions as part of an ongoing project. Figures from some publications have not yet been curated, or are not available for display because of copyright restrictions.

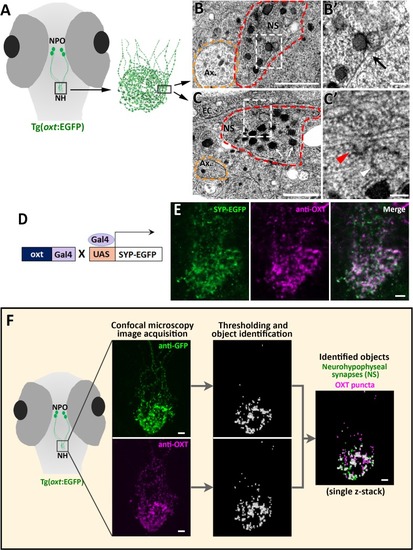
Confocal Z-stack images and three-dimensional render of 5 days post-fertilization (dpf) transgenic reporter zebrafish Tg(<italic>oxt</italic>:EGFP) following immunostaining with anti-EGFP and a specific antibody against endogenous OXT protein.

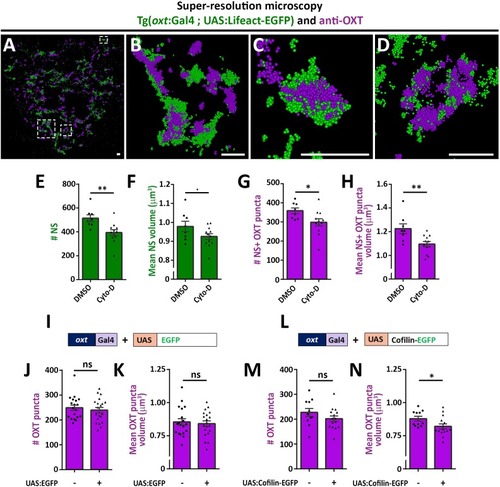
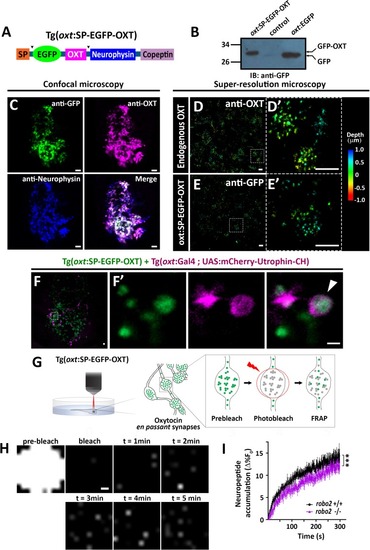
Three-dimensional render showing STORM images of endogenous OXT and Lifeact-EGFP in neurohypophyseal synapses.

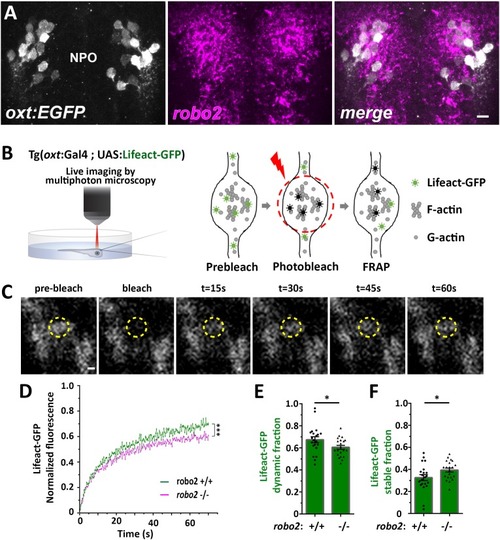
Robo2 regulates synaptic actin dynamics.

(A) robo2 is expressed in larval zebrafish neurosecretory preoptic area (NPO) and colocalizes with Oxytocin neurons. Confocal Z-stack images showing fluorescent in situ hybridization (FISH) of transgenic larvae Tg(oxt:EGFP) (3 days post-fertilization (dpf)) using probes directed against robo2 mRNAs (magenta), followed by anti-EGFP staining. The neurosecretory preoptic (NPO) area in which OXT neurons were labeled is shown. Scale bar: 20 µm. (B,C) Real-time monitoring of synaptic actin dynamics in live transgenic reporter Tg(oxt:Gal4; UAS:Lifeact-EGFP) larvae mounted in 0.1% low-melt agarose and imaged using multi-photon microscopy upon Fluorescence Recovery after Photobleaching (FRAP) (B). Time-series images of FRAP experiment in a neurohypophyseal synapse with Lifeact-EGFP expression (C). Scale bar: 200 nm. (D–F) Assessment of synaptic actin dynamics in robo2 mutant using the transgenic actin dynamics reporter Tg(oxt:Gal4; UAS:Lifeact-EGFP) larvae. Graph showing the normalized FRAP profile of Lifeact-EGFP fluorescence intensity in 6-dpf robo2+/+ (n = 19 synapses from seven larvae) and robo2-/- (n = 21 synapses from seven larvae) (D) (***p<2e-16) for genotypeXtime interaction effect in a linear mixed effects model to account for inter-synapse and inter-genotype variability (see Materials and methods). Bar graphs showing the dynamic (E) and stable (F) Lifeact-EGFP fractions in robo2+/+ vs robo2-/- neurohypophyseal synapses (*p<0.05 Student’s t-test; with Cohen’s d = 0.67). Error bars indicate SEM in (D–F).

10.7554/eLife.45650.011

Experimental data for <xref rid='fig4' ref-type='fig'>Figure 4</xref>: Actin dynamics in neurohypophyseal synapses.

The excel sheet includes values for FRAP data of neurohypophyseal synaptic Lifeact-EGFP in robo2 +/+ vs robo2 -/- larvae. The full-scale normalized values, dynamic and stable fraction generated from Easy-Frap software are shown.

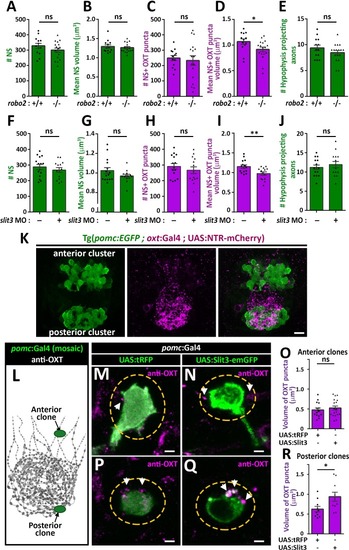
Slit3-Robo2 signaling regulates synaptic OXT levels.

(A–E) Assessment of synaptic oxytocin content in robo2 mutant was performed as described in Figure 1F. Graph showing the number and size of neurohypophyseal synapses (NS) (A,B) and colocalizing OXT puncta (C,D) and the number of neurohypophyseal projecting axons (E) in 8 days post-fertilization (dpf) robo2+/+ (n = 13) vs robo2-/- (n = 17) larvae (*p<0.05 Student’s t-test with Cohen's d = 0.82; ns denotes not significant). (F–J) Assessment of synaptic oxytocin content upon slit3 knock-down. Transgenic (oxt:EGFP) embryos were injected with injection buffer or injection buffer with 0.85 ng of morpholino targeted to the translational start site of slit3. Graph showing the number and size of NS (F,G) and colocalizing OXT puncta (H,I) and the number of neurohypophyseal projecting axons (J) in 8 days post-fertilization (dpf) control (n = 15) vs slit3 morpholino injected (n = 14) larvae (**p<0.05 with Cohen’s d = 1.23; ns denotes not significant, Student’s t-test). (K) Hypophyseal POMC cells are localized near OXT synapses. Confocal Z-stacks maximum intensity projection of hypophysis region of 5 day old triple transgenic (pomc:EGFP; oxt:Gal4; UAS:NTR-mCherry). The hypophysis area showing OXT NS adjacent to anterior and posterior clusters of POMC cells are shown. Scale: 10 μM. (L–R) Local overexpression in mosaic hypophyseal POMC clones located. Transgenic embryos expressing the pomc:Gal4 driver were injected with transposon-based transgenic vectors containing either control UAS:tRFP (M,P) or UAS: Slit3-EmGFP (N,Q). The injected 5-dpf larvae were subjected to immunostaining with anti-OXT protein and anti-GFP. OXT-puncta (arrows) within a distance of 2 μM (yellow dashed ellipse) from the clone surface were quantified. Scale bar: 2 µm. Bar graphs showing the mean volume of OXT puncta upon expression of tRFP vs Slit3 in hypophyseal POMC anterior (n = 15 and 18, respectively) or posterior clone (n = 10 and 10, respectively) position (*p<0.05 Student’s t-test with Cohen’s d = 1.14). Error bars indicate SEM in (A-J, O and R).

10.7554/eLife.45650.013

Experimental data for <xref rid='fig5' ref-type='fig'>Figure 5</xref>: Neurohypophyseal synaptic parameters upon gain- or loss-of function of <italic>slit3</italic> or <italic>robo2</italic>.

The excel sheet includes values for number and volume of neurohypophyseal synapses and OXT puncta from confocal imaging of larval neurohypophysis of multiple experiments namely: 1) robo2 +/+ vs robo2 -/- 2) Mock vs morpholino-injected embryos 3) Mosaic transgenesis experiments by hypophyseal expression of tRFP vs slit3.

Specificity of antibodies to oxytocin and neurophysin.

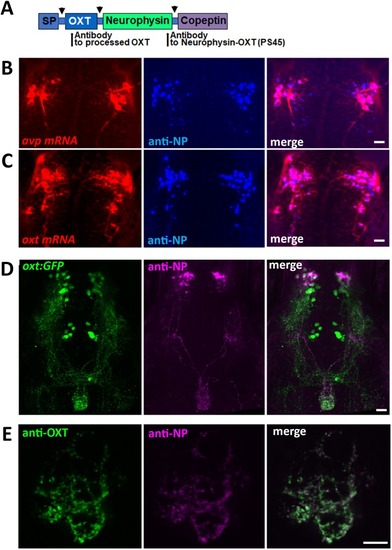
(A) Schema of protein coded by oxt gene. Antibodies anti-OXT and PS45 were targeted to processed OXT and neurophysin respectively. SP denotes signal peptide, arrow indicates cleavage site. Validation of the EGFP-OXT fusion protein is shown in Figure 3H. (B–F) Confocal Z-stack images showing Fluorescent in situ hybdridization (FISH) of 3 days post-fertilization (dpf) larvae using probes for avp (B) or oxt (C) mRNA (red), followed by PS45 staining. The neurosecretory preoptic (NPO) area in which oxytocin neurons were labeled is shown. Confocal maximum intensity projection (MIP) images showing immunostaining of 5-dpf old transgenic Tg(oxt:EGFP) larvae using antibodies directed against GFP and neurophysin (NP). The whole neurohypophyseal tract (D) and the hypophyseal projections (E) are shown. Scale: 10 μM.

EXPRESSION / LABELING:
Gene:
Antibody:
Fish:
Anatomical Term:
Stage: Day 5

Specificity of antibodies to oxytocin and neurophysin.

(A) Schema of protein coded by oxt gene. Antibodies anti-OXT and PS45 were targeted to processed OXT and neurophysin respectively. SP denotes signal peptide, arrow indicates cleavage site. Validation of the EGFP-OXT fusion protein is shown in Figure 3H. (B–F) Confocal Z-stack images showing Fluorescent in situ hybdridization (FISH) of 3 days post-fertilization (dpf) larvae using probes for avp (B) or oxt (C) mRNA (red), followed by PS45 staining. The neurosecretory preoptic (NPO) area in which oxytocin neurons were labeled is shown. Confocal maximum intensity projection (MIP) images showing immunostaining of 5-dpf old transgenic Tg(oxt:EGFP) larvae using antibodies directed against GFP and neurophysin (NP). The whole neurohypophyseal tract (D) and the hypophyseal projections (E) are shown. Scale: 10 μM.

Cdc42 regulates synaptic OXT levels.

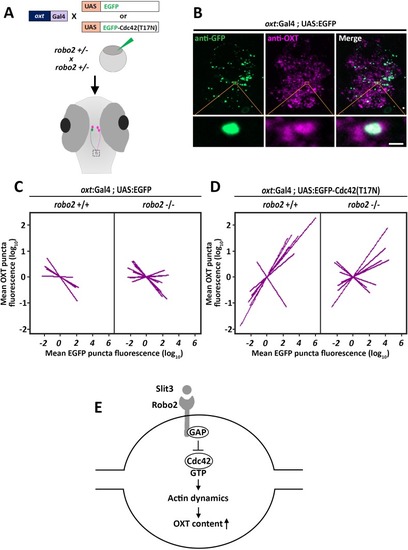
(A) Assessment of the effect of Oxytocin neuron-specific overexpression of actin-regulating protein Cdc42 in Tg(oxt:Gal4) larvae. Transgenic embryos expressing the oxt:Gal4 driver were injected with transposon-based transgenic vectors containing either control UAS:EGFP or UAS:Cdc42(G12V)-EGFP coding a constitutive active mutant Cdc42. Larvae were fixed at 8 days post-fertilization (dpf) and immunostained with anti-GFP and anti-OXT antibodies and neurohypophyseal synapse (NS) were identified as described above. (B,C) Linear regression analysis comparing between synaptic EGFP levels (mean EGFP puncta) as a function of OXT fluorescence (mean OXT puncta). The data were normalized using mean-centering approach using the scale function in the ‘R’ software. Each line represents a regression line of single animal. The correlation between the mean (log10) fluorescence value of OXT puncta and GFP expression in neurohypophyseal synapse was tested with a linear regression model (ANCOVA), accounting for the effect of GFP fluorescence, and individual fish. In UAS:EGFP injection, mean EGFP fluorescence in EGFP-positive NS is not correlated with OXT fluorescence (n = 20; and p>0.25, adj. R2 = 0.23) (B). In UAS:Cdc42(G12V) injection, mean EGFP-Cdc42(G12V) fluorescence in EGFP-positive NS negatively correlates with OXT fluorescence (n = 23; p<2.2e-16, adj. R2 = 0.47) larvae (C). Legends for Source data and Source code files.

Acknowledgments
This image is the copyrighted work of the attributed author or publisher, and ZFIN has permission only to display this image to its users. Additional permissions should be obtained from the applicable author or publisher of the image. Full text @ Elife