FIGURE SUMMARY
Title

Thyroid hormone regulates distinct paths to maturation in pigment cell lineages

Authors
Saunders, L.M., Mishra, A.K., Aman, A.J., Lewis, V.M., Toomey, M.B., Packer, J.S., Qiu, X., McFaline-Figueroa, J.L., Corbo, J.C., Trapnell, C., Parichy, D.M.
Source
Full text @ Elife

ZFIN is incorporating published figure images and captions as part of an ongoing project. Figures from some publications have not yet been curated, or are not available for display because of copyright restrictions.

TH-dependent phenotypes and models for TH action.

(A) Euthyroid and hypothyroid zebrafish [stage 10 (mm) standardized standard length (SSL) (Parichy et al., 2009); ~21 d post-fertilization, dpf]. Insets, yellow/orange xanthophores of euthyroid fish and absence of these cells in hypothyroid fish. (B) Models for TH effects on alternative cell types derived from a common progenitor (P), by regulating: (i) cell fate specification; or (ii) amplification and restraint of committed cell-types by differential effects on morphogenesis or differentiation.

Experimental design and isolation of NC-derived cells from post-embryonic zebrafish.

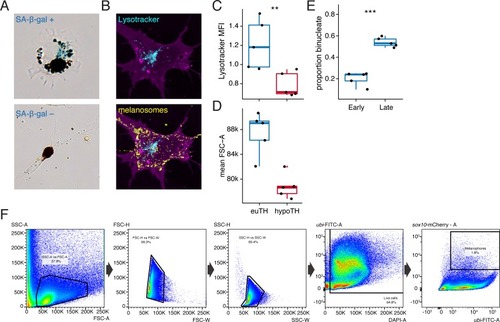
(A) Fish transgenic for sox10:cre and ubi:loxP-EGFP-loxP-mCherry permanently and robustly expressed mCherry in NC-derived cells of both euthyroid and hypothyroid fish (Kague et al., 2012; Mosimann et al., 2011). At superficial layers, mCherry+ xanthophores (yellow arrowheads), melanophores (red arrowheads), and iridophores (blue dotted line) were apparent. At deeper layers, mCherry+ cells were found in dorsal root ganglia (magenta arrowheads) and other locations (e.g. mint arrowheads), potentially representing glia, neurons, progenitors and other cell types. mCherry+ cells of non-NC origin were evident as well (see Figure 2—figure supplement 2). Stage shown is 9.8 SSL (Parichy et al., 2009). (B) Single-cell RNA-Seq (scRNA-Seq) experimental design. To ensure that progenitors, cells at intermediate states of specification and commitment, and fully differentiated cells were captured, euthyroid and hypothyroid fish were collected at a range of stages encompassing adult pattern formation (7.2–9.8 SSL) and from juvenile fish (11 SSL) in which the first two adult stripes had fully formed. To compare transcriptomic signatures of NC-derived cells from embryonic–early larval and middle larval–juvenile stages, cells were additionally collected from euthyroid larvae at 5 dpf (3.5 SSL). (C) Representative FAC sort for NC-derived cells from post-embryonic skins and trunks. Single cells were isolated by sequentially gating cells according to their SSC-A vs. FSC-A, FSC-H vs. FSC-W, and SSC-H vs. SSC-W profiles according to standard flow cytometry practices. Cells with high levels of DAPI staining were excluded as dead or damaged. NC-derived cells were isolated by identifying cells with high fluorescence in the mCherry-A channel which describes expression of the ubi:loxP-EGFP-loxP-mCherry transgene after permanent conversion to ubi:mCherry upon exposure to sox10:Cre (see Figure 2—figure supplement 1A).

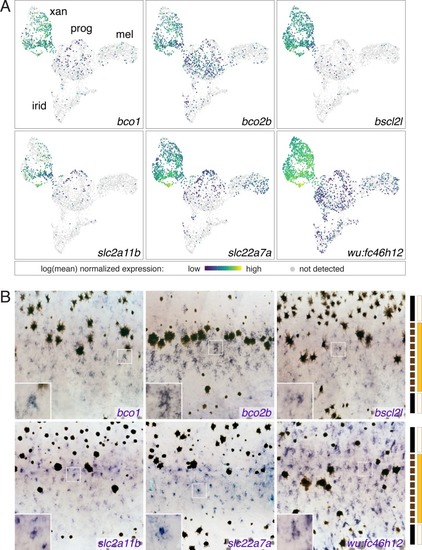
Xanthophore cluster-specific expression identifies novel xanthophore markers.

(A) UMAP plots of pigment cells colored by expression of xanthophore cluster-enriched genes (bco1, bco2b, bscl2l, slc2a11b, slc22a7a, wu:fc46h12). (B) Expression in xanthophores of genes shown in A, as revealed by whole-mount in situ hybridization patterns corresponding to those of known xanthophore lineage markers and localization of differentiated and cryptic xanthophores (Hamada et al., 2014; Lang et al., 2009; McMenamin et al., 2014; Parichy et al., 2000b). Insets show at higher magnification blue-stained cells of xanthophore lineage. Bars at right indicate cell positions relative to anatomy of final pattern: solid black, melanophores in prospective stripe regions; dashed black, melanophores transiently located in prospective interstripe region; light yellow, xanthophores likely to remain cryptically (unpigmented) within stripes; orange, xanthophores likely to develop pigmentation in the interstripe.

EXPRESSION / LABELING:
Genes:
Fish:
Anatomical Term:
Stage: Days 21-29

Iridophore cluster-specific expression identifies novel iridophore markers.

(A) UMAP plots of pigment cells colored by expression of iridophore cluster-specific genes (alx4a, alx4b, crip2, defbl1). (B) Whole-mount in situ hybridization of genes in A reveals patterns corresponding to previously described iridophore markers and locations (Lang et al., 2009; Patterson and Parichy, 2013; Spiewak et al., 2018). Insets, higher magnification views of blue-stained iridophores in the prospective interstripe (upper) and within or near prospective stripe (lower). Bars at right indicate cell positions relative to final pattern features: solid black, melanophores in prospective stripe regions; dashed black, melanophores in prospective interstripe; solid blue, dense iridophores of interstripe; dashed blue, sparse iridophores of stripe.

EXPRESSION / LABELING:
Genes:
Fish:
Anatomical Term:
Stage: Days 21-29

Melanophore binucleation incidence data corresponding to <xref rid='fig5s1' ref-type='fig'>Figure 5—figure supplement 1E</xref>.

Melanophore binucleation incidence data corresponding to <xref rid='fig5s1' ref-type='fig'>Figure 5—figure supplement 1E</xref>.

Expression of multiple carotenoid-related genes in xanthophores are affected by TH.

UMAP plots of pigment cell clusters colored by expression of TH-dependent genes in xanthophores: gstm.3 (q = 6.9E-99, log2fold-change = 4.3), plin6 (q = 1.9E-13, log2fold-change = 1.3), scarb1 (q = 3.5E-11, log2fold-change = 1.2).

10.7554/eLife.45181.025

Xanthophore lipid droplet incidence corresponding to <xref rid='fig6s2' ref-type='fig'>Figure 6—figure supplement 2A</xref>.

TH promotes development of lipid-filled carotenoid droplets in xanthophores.

(A) Carotenoid pigments are normally localized to lipid droplets, the presence of which can be revealed by Oil-red-O staining. Here, a proportion of aox5:palmEGFP+ xanthophores stained ex vivo from euthyroid fish (n = 112 cells) contained lipid (red), whereas xanthophores from hypothyroid fish (n = 48 cells) were never observed to have such lipid contents. (Incidence data in supplementary file Figure 6—figure supplement 1—source data 1.) (B) Ultrastructurally, carotenoids and lipids are detectable as electron-dense carotenoid vesicles (red circles) (Djurdjevič et al., 2015; Granneman et al., 2017; Obika, 1993), which were observed in xanthophores from euthyroid but not hypothyroid fish. N, nucleus. P, pterinosome—the pteridine-containing organelle of xanthophores (Bagnara et al., 1968; Hirata et al., 2003; Matsumoto, 1965; Obika, 1993).

<italic>scarb1</italic> is specifically involved in xanthophore maturation and is induced by TH.

(A) Scarb1 protein alignment. Zebrafish scarb1 mutants had a 105 bp, in-frame deletion in a conserved region of the protein. (B) scarb1 mutants lacked mature, interstripe xanthophores but had normal stripes and aox5:palmEGFP expression, suggesting that patterning and unpigmented xanthophores were normal. (C) In hypothyroid fish treated with exogenous TH (T4), scarb1 expression was rescued within ~1 d (upper) and carotenoid autofluorescence of xanthophores was recovered within ~2 d (lower).

Xanthophores switch yellow pigmentation programs during the larval-to-adult transition.

(A) At 5 dpf, scarb1 mutants had yellow larval xanthophores with wild-type levels of pteridines. (B) Carotenoids were not detectable in EL zebrafish (5 dpf, wild-type; compare to Figure 3D); csf1ra mutants, which lack xanthophores, had HPLC profiles indistinguishable from wild-type. (C) Carotenoid and pteridine pathway signature scores for xanthophores in euthyroid EL and euthyroid and hypothyroid adult scRNA-Seq data sets. Box plots as in Figure 3 with different letters above data indicating significant differences in post hoc comparisons (carotenoid, p<2e-16; pteridine, p=0.01; Tukey HSD). Pteridine signatures between EL, hypothyroid, and euthyroid xanthophores were more similar than carotenoid signatures. (D) Ammonia-induced pteridine fluorescence was present in adult xanthophores of both euthyroid and hypothyroid fish (red arrowheads).

Zebrafish TR gene expression and mutants.

(A) RT-PCR for thraa, thrab, and thrb in xanthophores and melanophores sorted by FACS for aox5:palmEGFP and tyrp1b:palm-mCherry, respectively. (B) Sanger sequencing of CRISPR/Cas9-induced mutant allele of thrab revealed a 13 bp deletion. (C) Schematic of Thrab wild-type and mutant proteins illustrating introduction of a novel amino acid followed by a premature stop codon at position 73. DBD, DNA-binding domain; LBD, ligand binding domain. (D) Additional CRISPR/Cas9 mutant alleles for thraa and thrb had phenotypes indistinguishable from wild-type or thrab (Figure 7A). (E) Xanthophore color phenotypes of euthyroid and hypothyroid wild-type fish, and rescue of xanthophore color in hypothyroid fish upon TR mutation (thrab thraa thrb*). (F) HPLC revealed persisting carotenoids in hypothyroid fish mutant for thrab (boxed region), in contrast to the absence of detectable carotenoids in hypothyroid fish that were wild-type for thrab (Figure 6D). (G) Stage of first xanthophore appearance did not differ significantly (p=0.7) between euthyroid fish that were heterozygous or homozygous wild-type for thrab mutation.

Acknowledgments
This image is the copyrighted work of the attributed author or publisher, and ZFIN has permission only to display this image to its users. Additional permissions should be obtained from the applicable author or publisher of the image. Full text @ Elife