
- Title
-
Pioneer axons employ Cajal's battering ram to enter the spinal cord
- Authors
- Nichols, E.L., Smith, C.J.
- Source
- Full text @ Nat. Commun.

Sensory pioneer axons contact the dorsal root entry zone (DREZ) before arrival of boundary cap cells. a Diagram of the dorsal root ganglia (DRG) and DREZ following pioneer axon entry. Measurements are taken from (b). b Distance from the soma-ensheathing glia to the DREZ and length of the pioneer axon at 72 h post fertilization (hpf). c Confocal z-projection frames of a Tg(ngn1:gfp); Tg(gfap:nsfb-mcherry) zebrafish stained for Sox10 at 56 hpf showing absence of Sox10 staining at the DREZ. d Quantification of the number of Sox10+ cell bodies located in the DRG and at the DREZ at 56 hpf. SEM is shown, n = 25 DRG. e Confocal z-projection frames from a 24-h time-lapse starting at 48 hpf of a Tg(sox10:gal4); Tg(uas:mcherry); Tg(ngn1:gfp) animal before, during, and after pioneer axon entry. The mCherry+/GFP- glia do not extend with the mCherry+/GFP+ neuron to the DREZ. Green brackets denote length of axon. Red brackets denote length of glia. f Growth cone insets and rendering from (e) confirming absence of glial processes at the DREZ. White arrows denote growth cone. White arrowheads denote glial leading edge. Green drawing denotes axon tracing. Red drawing denotes glial tracing. gQuantification of the distance between the pioneer axon (red) and associated glia (green) during axon extension, demonstrating DREZ contact by the pioneer axon before glial DREZ arrival. Dashed black line denotes the location of the DREZ. hQuantification of the time between axon initiation and axonal or glial contact of the DREZ. The axon consistently contacts the DREZ before associated glia, n = 9 DRG. Unpaired Student’s t-test (h). Scale bars denote 10 µm |

Pioneer axon changes morphology and velocity during glia limitans crossing. aConfocal y-orthoganol and z-projection frames from a 24-h time-lapse starting at 48 h post fertilization (hpf) of a Tg(gfap:gfp); Tg(sox10:mrfp) zebrafish showing axon navigation to the dorsal root entry zone (DREZ). White arrows denote the growth cone. b Deconvolved confocal single-frames from a 24-h time-lapse starting at 48 hpf of the pioneer axon of a Tg(sox10:mrfp) zebrafish before during and after glia limitans crossing. The growth cone swells during spinal entry. White box denotes the growth cone. c–e Diagram of the y- and z-planes of the DREZ showing how the graphs of (d, e) were taken on y-orthogonal images. Graphs in (d, e) denote intensity profiles of Tg(gfap:gfp) and Tg(sox10:mrfp) across the y- (d) and z-planes (e) of the growth cone in y-orthogonal images before, during, and after entry at the DREZ. The green fluorescent protein (GFP) intensity at the DREZ specifically decreases during axon entry. Red arrows denote decrease in Tg(gfap:gfp) intensity during pioneer axon entry. SEM is shown, n = 13 DREZ. f Quantification of the distance traveled by representative growth cones from the point of initiation through entry into the DREZ. Arrows denote time of axon (red) and glia (green) DREZ contact from Fig. 1g. Blue shaded box denotes the time the growth cone is at the DREZ. Blue lines denote SEM of 4 axons. g Average velocity form of the growth cones before, during, and after entry. SEM is shown, n = 4 pioneer axons. Scale bars denote 10 µm in (a) and 5 µm in (b). Tukey’s honestly significant difference (HSD) (g) |

An actin-rich structure forms in pioneer axons during spinal entry. a Confocal z-projection frames from a 24-h time-lapse starting at 48 h post fertilization (hpf) of Tg(sox10:lifeact-GFP) zebrafish showing navigation of the pioneer axon into the spinal cord. Actin accumulates in the central growth cone specifically at the dorsal root entry zone (DREZ). Red arrows denote the actin-rich structure at the tip of the growth cone. Orange dotted box denotes DREZ. Entry occurs at 50 min. bRepresentative intensity profile of Lifeact-GFP at the growth cone (left y-axis, black line) and distance traveled by the growth cone (right y-axis, gray line). Actin concentration specifically occurs during stalling and entry. Shaded blue box denotes the period of axon entry at the DREZ. c Quantification of average intensity of Lifeact-GFP at the growth cone before, during, and after entry to the spinal cord. SEM is shown, n = 6. d Distance of Lifeact-GFP concentrate form the tip of the growth cone before, during, and after entry to the spinal cord. SEM is shown, n = 6. e Deconvolved confocal images of actin-rich structures in Tg(sox10:lifeact-GFP)animals in lateral and cross-sectional views demonstrating the basally projecting actin cluster at the DREZ. Red arrow denotes the same protruding actin concentrate. Red arrowhead denotes basally projecting lifeact-GFP protrusion. Compass shown to right of image denote directional locations on animal. D dorsal, V ventral, A anterior, P posterior, L lateral, M medial. f Confocal z-projection frames from a 24-h time-lapse starting at 48 hpf of Tg(sox10:lifeact-GFP); Tg(gfap:nsfb-mcherry) zebrafish showing navigation of the pioneer axon into the spinal cord. Orange dotted box denotes DREZ. g Intensity profile of Lifeact-GFP at the growth cone. Gray box denotes period of actin concentrate formation. SEM is shown, n = 11 pioneer growth cones. h Intensity profile of Tg(gfap:nsfb-mcherry) at the DREZ. Gray box denotes period of actin concentrate formation in the growth cone. mCherry intensity at the DREZ specifically decreases during actin accumulation in the growth cone. SEM is shown, n = 11 DREZ. i Intensity profiles of Tg(sox10:lifeact-GFP)and Tg(gfap:nsfb-mcherry) across the y- and z-planes of the growth cone in y-orthogonal images before, during, and after entry at the DREZ. The y- and z-planes determined as shown in Fig. 2b. White arrowhead denotes the glia limitans. Black arrowhead denotes the radial glia cell soma. SEM is shown, n = 11 DREZ. j The y-orthogonal images of used to create intensity profiles in (i). Scale bars denote 10 µm. Tukey’s honestly significant difference (HSD) (d) |

Actin-rich structures form to cross a radial glial boundary. a Confocal z-projection image of a Tg(sox10:mrfp); Tg(gfap:gfp) zebrafish after focal lesions at the dorsal root entry zone (DREZ), displaying the mechanism of focal ablations with adjacent, control non-lesioned nerves. Dashed blue lines indicate the plane shown in the y-orthogonal images. Dashed white boxes denote area of lesion. b Confocal z-projection frames from a 24-h time-lapse starting at 48 h post fertilization (hpf) of Lifeact-GFP, Tg(gfap:nsfb-mcherry) zebrafish showing navigation of the pioneer axon into the spinal cord in animals with a lesioned DREZ and a non-lesioned DREZ. Axons with lesioned DREZ fail to form actin concentrates. Red arrows denote the tip of the growth cone. White dotted box denotes the DREZ lesion. Orange dotted box denotes DREZ. c Quantification of DREZ-located axons that form actin-rich structures with a lesioned and non-lesioned DREZ. SEM is shown, n = 9 dorsal root ganglia (DRG) with a lesioned DREZ, n = 8 DRG with a non-lesioned DREZ. dQuantification of relative intensity of Tg(gfap:nsfb-mcherry) at the DREZ in wildtype (n = 10 DRG), lesioned (n = 9 DRG), and non-lesioned (n = 8 DRG) animals. SEM is shown. e Confocal images of a Tg(sox10:mrfp) growth cone during spinal cord entry with a lesioned and non-lesioned DREZ. f Quantification of duration of actin concentrates in wildtype, lesioned, and non-lesioned animals. SEM is shown, n = 10 wildtype animals, n = 8 non-lesioned animals, n = 9 lesioned animals. gQuantification of time of initiation of actin concentrates in wildtype, lesioned, and non-lesioned animals. Dotted blue line denotes when axons approach the DREZ. SEM is shown, n = 10 wildtype animals, n = 8 non-lesioned animals, n = 9 lesioned animals. h Representative intensity profile of Tg(sox10:lifeact-GFP) and Tg(gfap:nsfb-mcherry) through the z-plane of the growth cone and corresponding y-orthogonal image in a non-lesioned DREZ after entry. Measurements collected as described in Fig. 2b. i Representative intensity profile of Tg(sox10:lifeact-GFP) and Tg(gfap:nsfb-mcherry) through the z-plane of the growth cone and corresponding y-orthogonal image in a lesioned DREZ after axon entry. Measurements collected as described in Fig. 2b. Scale bars denote 10 µm. Tukey’s honestly significant difference (HSD) (d, f, g) |
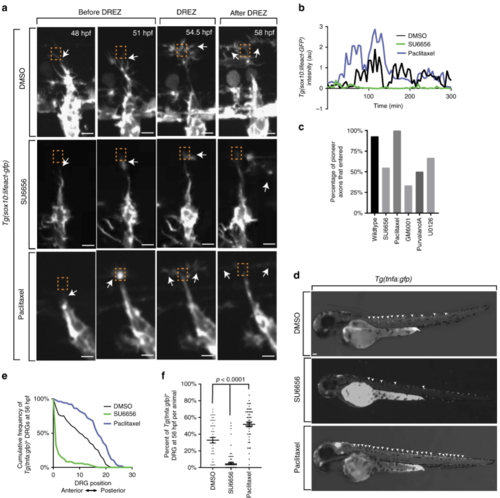
Actin-rich invasion components are necessary and sufficient for axon entry. aConfocal z-projection frames from a 24-h time-lapse starting at 48 h post fertilization (hpf) of Lifeact-GFP animals showing navigation of the pioneer axon into the spinal cord in animals treated with dimethyl sulfoxide (DMSO), SU6656, and paclitaxel. White arrows denote the tip of the growth cone. Orange dotted box denotes dorsal root entry zone (DREZ). Axon approaches DREZ at 300 min. bRepresentative intensity profiles of Lifeact-GFP expression at the growth cone in animals treated with DMSO (black), SU6656 (green), and paclitaxel (blue). SU6656-treated axons fail to form actin concentrates, while paclitaxel-treated axons form early and robust concentrates. Gray box denotes the formation of actin-rich invasion components in the DMSO- and paclitaxel-treated animals. c Quantification of axons that entered the spinal cord in animals treated with DMSO (n = 14 dorsal root ganglia (DRG)), SU6656 (n = 20 DRG), paclitaxel (n = 13 DRG), GM6001 (n = 18), purvalanol A (n = 18 DRG), and U0126 (n = 20 DRG). Inhibitors of cell invasion prevent axon entry. d Lateral images taken at 56 hpf of Tg(tnfa:gfp) animals treated with DMSO, SU6656, or/and paclitaxel. Arrowheads denote Tg(tnfa:gfp)+ DRG. eCumulative frequency of animals treated with SU6656, paclitaxel, and DMSO that express Tg(tnfa:gfp) at each DRG at 56 hpf; n = 86 SU6656-treated fish, n = 50 paclitaxel-treated fish, n = 48 DMSO-treated fish. f Bar graph of the percentage of DRG that were Tg(tnfa:gfp)+ at 56 hpf in animals treated with SU6656, paclitaxel, and DMSO; n = 86 SU6656-treated fish, n = 50 paclitaxel-treated fish, n = 48 DMSO-treated fish. SEM is shown. Scale bars denote 10 µm in (a) and 0.1 mm in (d). One-way analysis of variance (ANOVA) (f) |

Invadopodia are cell autonomously required for spinal entry. a Confocal z-projection images taken from a 24-h time-lapse starting at 48 h post fertilization (hpf) of a Tg(sox10:lifeact-GFP); Tg(sox10:PA-Rac1-mcherry) zebrafish with both photoactivated and non-photoactivated Rac1. Orange box denotes dorsal root entry zone (DREZ). White arrow denotes growth cone. b Quantification of the number of PA-Rac1+ neurons that enter the spinal cord. Photoconverted neurons fail to enter the spinal cord. SEM is shown, n = 10 non-photoactivated dorsal root ganglia (DRG), n = 9 photoactivated DRG. c Quantification of the number of PA-Rac1+ neurons that form actin-invasive structures. Photoactivated neurons fail to form actin-invasive components. SEM is shown, n = 10 DRG. d Intensity profiles of growth cone Lifeact-GFP in neurons with photoactivated (n = 9) and non-photoactivated (n = 10) Rac-1. eDistance traveled by neurons with photoactivated (n = 9) and non-photoactivated (n = 10) Rac-1. f Confocal of two growth cones of a Tg(sox10:lifeact-GFP) animals stained for Cortactin showing co-localization of Cortactin with Lifeact-GFP foci at the DREZ. g Confocal images of a Tg(ngn1:gfp) animals stained for pSrc showing localization of pSrc in pioneer growth cones. Scale bars denote 10 µm in (a) and 5 µm in (f, g). Insets in (f, g) are single-plane confocal images |
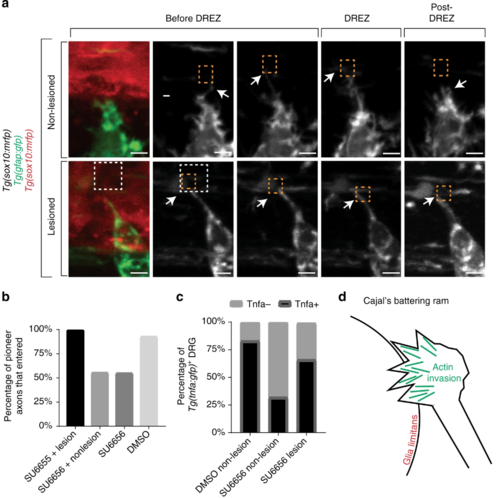
Entry defects from failed invasion are rescued by dorsal root entry zone (DREZ) lesioning. a Confocal z-projection frames from a 24-h time-lapse starting at 48 h post fertilization (hpf) of Tg(gfap:gfp), Tg(sox10:lifeact-gfp) zebrafish treated with SU6656 with and without a DREZ lesion showing pioneer axon navigation. bQuantification of pioneer axon entry in animals treated with SU6656 and a lesioned DREZ (n = 12), SU6656 without a lesioned DREZ (n = 9), SU6656 (n = 20), and dimethyl sulfoxide (DMSO; n = 14). SEM is shown. c Quantification of Tg(tnfa:gfp)+dorsal root ganglia (DRG) in animals treated with DMSO without a DREZ lesion (n = 30), animals treated with SU6656 without a DREZ lesion (n = 30), and animals treated with SU6656 with a DREZ lesion (n = 28). d Schematic representation of actin-rich invasion that comprises Cajal’s battering ram. Scale bars denote 10 µm |

Supplementary Figure 1. Glial projections do not extend with the pioneer axon to the DREZ, related to Figure 1. (A). Confocal z-projection frames from a 24-hr timelapse starting at 48 hpf of a Tg(sox10:eos) zebrafish with a photoconverted neuron. White arrow denotes pioneer axon growth cone. White arrowhead denotes trail-ing glial process. Images on the right show the growth cone contacting the DREZ with traced representations of the neuron (red) and glia (green) (B). Confocal z-projection frames of a 24-hr time-lapse starting at 48 hpf of a Tg(sox10:mrfp) with mosaic expression of ngn1:megfp. The pioneer axon leads the associated glia throughout its navigation before, during, and after DREZ entry. White and green arrows denotes growth cone, and white and red arrowheads denotes the trailing glia. Insets shown below represent the pioneer growth cone in single-planes. Scale bars denote 10 µm. |
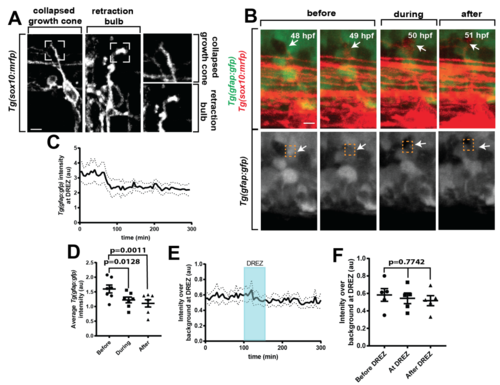
Axon entry corresponds with rearrangement of radial glia, related to Figure 2. (A). Confocal z-projection frames of Tg(sox10:mrfp) animals showing the morphologies of a collapsed growth cone and a retraction bulb. (B). Confocal z-projection frames from a 24-hr timelapse starting at 48 hpf of Tg(sox10:mrfp); Tg(gfap:gfp) zebrafish showing navigation of the pioneer axon crossing the radial glia membrane at the DREZ. White arrows denote the area of glial rearrangement during axon entry. Orange dotted box denotes DREZ. (C). Intensity profile of Tg(gfap:gfp) at the DREZ, n=7. Arrowhead denotes intensity during period of growth cone stalling at the DREZ. (D). Tg(gfap:gfp) intensity at the DREZ for before entry, during entry, and after entry. SEM is shown, n=7. (E). Quantification of Tg(gfap:gfp) intensity at the DREZ during failed entry into the spinal cord, SEM is shown, n=5 DREZ. (F). Tg(gfap:gfp) intensity at the DREZ during failed entry before DREZ navigation, during DREZ navigation, and after DREZ. SEM is shown, n=5. (D,F) use a one-way ANOVA and p-values in (D) are corrected for multiple comparisons. Scale bars denote 10 µm. |

Focal lesions cause ablation of glia limitans, related to Figure 4. (A-B). Confocal images of a Tg(ngn1:gfp); Tg(gfap:nsfb-mcherry) zebrafish with (B) and without (A) a DREZ lesion. Images taken of the DREZ using transmitted light are also included. Dashed white box denotes lesion. (C). Confocal images of a Tg(ngn1:gfp); Tg(gfap:nsfb-mcherry) zebrafish with a lesioned DREZ stained for GFAP. Dashed white box denotes lesion. (D). Quantification of the percent of axons with a lesioned and nonlesioned DREZ that form anterior and posterior projections in the spinal cord. n=5 lesioned, n=5 non-lesioned. (E). Graph of distance traveled by axons with a lesioned (green) and non-lesioned (blue) DREZ. Shaded blue box denotes the area of the DREZ. Dotted lines denote SEM. Note: Lesioned axons travel further distances because of the absence of stalling at the DREZ. Scale bars denote 10 µm. |
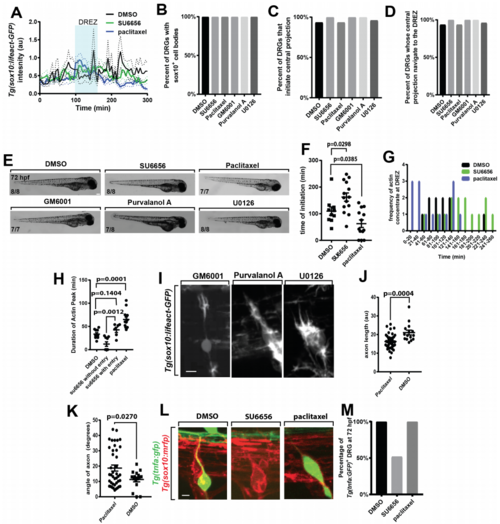
Pharmacological treatments impact pioneer axon DREZ entry, related to Figure 5. (A). Lifeact-GFP intensity tracings in the pioneer axon in animals treated with DMSO (black, n=14), SU6656 (green, n=20), and paclitaxel (blue, n=13). (B-D). Quantification of percent of DRG with Sox10+ cell bodies (B), that initiate a central projection (C), and that navigate to the DREZ (D) in animals treated with DMSO (n=14), SU6656 (n=20), paclitaxel (n=13), GM6001 (n=18), purvalanol A (n=18), and U0126 (n=20). (E). Images of embryo morphology at 72 hpf following treatment with DMSO, SU6656, paclitaxel, GM6001, purvalanol A, or U0126 starting at 36 hpf (F). Quantification of time of actin concentrate initiation in animals treated with DMSO, SU6656, and paclitaxel. SEM is shown, n=14 nerves treated with SU6656, n=14 nerves treated with DMSO, n=13 nerves treated with paclitaxel. (G). Histogram of the time of actin concentrate formation in animals treated with DMSO (black), SU6656 (green), and paclitaxel (blue). n=14 nerves treated with SU6656, n=14 nerves treated with DMSO, n=13 nerves treated with paclitaxel. (H). Quantification of duration of actin concentrate in animals treated with DMSO, animals treated with paclitaxel, animals treated with SU6656 whose axons enter the spinal cord, and animals treated with SU6656 whose axons do not enter the spinal cord. SEM is shown, n=6 nerves treated with SU6656 that do not enter the spinal cord, n=9 nerves treated with SU6656 that enter the spinal cord, n=13 nerves treated with paclitaxel, n=14 nerves treated with DMSO. (I). Confocal z-projection images of a Tg(sox10:lifeact-gfp) animal treated at 36 hpf with GM6001, purvalanol A, and U0126. (J). Quantification of axon length in animals treated with paclitaxel or DMSO. Length measured from the point of axon bifurcation in the spinal cord to the cell soma. SEM is shown, n=42 DRG treated with paclitaxel, n=15 DRG treated with DMSO. Angle measured from the point of axon bifurcation in the spinal cord to the cell soma. SEM is shown, n=42 DRG treated with paclitaxel, n=15 DRG treated with DMSO. (K). Quantification of axon angle in animals treated with paclitaxel or DMSO. (L). Confocal zprojection frames taken at 72 hpf of Tg(tnfa:gfp), Tg(sox10:mrfp) zebrafish showing the DRG cell body and axon in animals treated with DMSO, SU6656, and paclitaxel. (M). Quantification of DRG expressing Tg(tnfa:gfp) at 72 hpf in animals treated with DMSO (n=60 DRG), SU6656 (n=118 DRG), and paclitaxel (n=68). SEM is shown. Scale bars denote 0.1 mm in (E) and 10 µm in (I,L). (F,H) use a Tukey’s HSD and (J,K) use a Student’s t-test. |