
Fig. S4
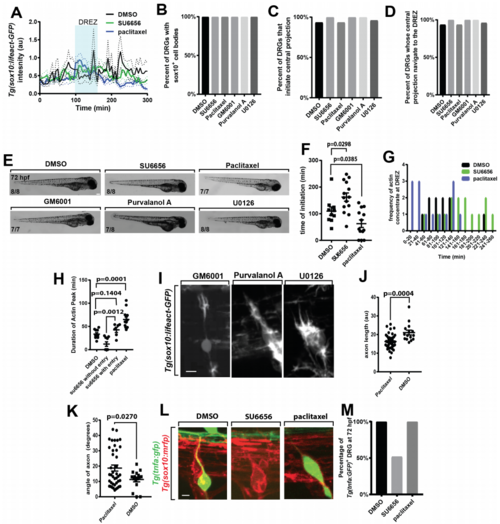
Pharmacological treatments impact pioneer axon DREZ entry, related to Figure 5. (A). Lifeact-GFP intensity tracings in the pioneer axon in animals treated with DMSO (black, n=14), SU6656 (green, n=20), and paclitaxel (blue, n=13). (B-D). Quantification of percent of DRG with Sox10+ cell bodies (B), that initiate a central projection (C), and that navigate to the DREZ (D) in animals treated with DMSO (n=14), SU6656 (n=20), paclitaxel (n=13), GM6001 (n=18), purvalanol A (n=18), and U0126 (n=20). (E). Images of embryo morphology at 72 hpf following treatment with DMSO, SU6656, paclitaxel, GM6001, purvalanol A, or U0126 starting at 36 hpf (F). Quantification of time of actin concentrate initiation in animals treated with DMSO, SU6656, and paclitaxel. SEM is shown, n=14 nerves treated with SU6656, n=14 nerves treated with DMSO, n=13 nerves treated with paclitaxel. (G). Histogram of the time of actin concentrate formation in animals treated with DMSO (black), SU6656 (green), and paclitaxel (blue). n=14 nerves treated with SU6656, n=14 nerves treated with DMSO, n=13 nerves treated with paclitaxel. (H). Quantification of duration of actin concentrate in animals treated with DMSO, animals treated with paclitaxel, animals treated with SU6656 whose axons enter the spinal cord, and animals treated with SU6656 whose axons do not enter the spinal cord. SEM is shown, n=6 nerves treated with SU6656 that do not enter the spinal cord, n=9 nerves treated with SU6656 that enter the spinal cord, n=13 nerves treated with paclitaxel, n=14 nerves treated with DMSO. (I). Confocal z-projection images of a Tg(sox10:lifeact-gfp) animal treated at 36 hpf with GM6001, purvalanol A, and U0126. (J). Quantification of axon length in animals treated with paclitaxel or DMSO. Length measured from the point of axon bifurcation in the spinal cord to the cell soma. SEM is shown, n=42 DRG treated with paclitaxel, n=15 DRG treated with DMSO. Angle measured from the point of axon bifurcation in the spinal cord to the cell soma. SEM is shown, n=42 DRG treated with paclitaxel, n=15 DRG treated with DMSO. (K). Quantification of axon angle in animals treated with paclitaxel or DMSO. (L). Confocal zprojection frames taken at 72 hpf of Tg(tnfa:gfp), Tg(sox10:mrfp) zebrafish showing the DRG cell body and axon in animals treated with DMSO, SU6656, and paclitaxel. (M). Quantification of DRG expressing Tg(tnfa:gfp) at 72 hpf in animals treated with DMSO (n=60 DRG), SU6656 (n=118 DRG), and paclitaxel (n=68). SEM is shown. Scale bars denote 0.1 mm in (E) and 10 µm in (I,L). (F,H) use a Tukey’s HSD and (J,K) use a Student’s t-test. |