- Title
-
Junction-based lamellipodia drive endothelial cell rearrangements in vivo via a VE-cadherin-F-actin based oscillatory cell-cell interaction
- Authors
- Paatero, I., Sauteur, L., Lee, M., Lagendijk, A.K., Heutschi, D., Wiesner, C., Guzmán, C., Bieli, D., Hogan, B.M., Affolter, M., Belting, H.G.
- Source
- Full text @ Nat. Commun.
|
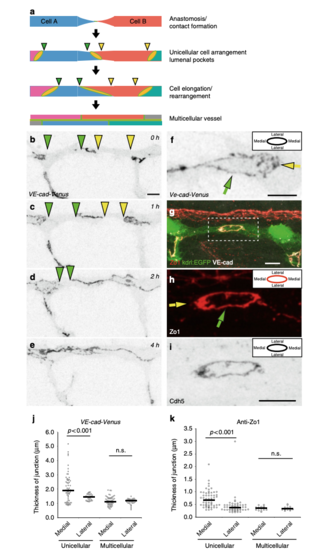
Polarized thickness in remodeling junctions. a Schematic model of cellular rearrangements during formation and maturation of dorsal longitudinal anastomosing vessel (DLAV) in zebrafish. At first, the tip cells (Cell A and B) of two anastomosing endothelial sprouts contact and form a de novo junction. Next, a vessel with unicellular architecture is formed, where junctions are not interconnected but are visible as separate rings. Then, through cellular rearrangement and elongation, the junctions elongate along vessel axis until junctions are interconnected and vessel reaches the final multicellular architecture. The edges of the junctional gaps in the unicellular vessels are marked with green and yellow triangles. b–e Still pictures of a time-lapse movie (Supplementary Movie 1) showing EC junctions of Tg(BAC(cdh5:cdh5-ts)) embryo, which expresses VE-cad-Venus fusion protein, during transition from unicellular to multicellular vessel during DLAV formation, in inversed contrast starting around 28 hpf. The edges of the junctional gaps in the unicellular vessels are marked with green and yellow triangles. f Close-up image of VE-cad-Venus embryos. The diffuse thickening of medial domain of the junction is marked with a yellow arrow. g–iWhole-mount immunofluorescence staining of the DLAV using anti-ZO1, anti-VE-cad (rat) of 28–30 hpf (Tg(kdrl:EGFPs843)) embryos. h The yellow arrow points to the medial junctional domain and the green arrow to the lateral junctional domain. j Quantification of junctional thickness measurements. n = 44 unicellular junctions and 48 multicellular junctions from 5 VE-cad-Venus Tg(BAC(cdh5:cdh5-ts)) embryos. Non-parametric Kruskal–Wallis test was used. k Quantification of the junctional thickness measurements from immunostainings of Tg(kdrl:EGFPs843) embryos. n = 58 unicellular junctions and 17 multicellular junctions from 8 embryos. Non-parametric Kruskal–Wallis test was used. Scale bars 10 µm |
|
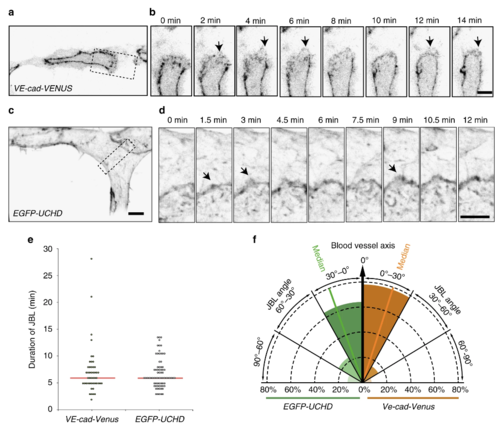
Active VE-cad and F-actin behavior of junction-based lamellipodia. a, b Still images from a movie (Supplementary Movie 2) of a VE-cad-Venus expressing embryo Tg(BAC(cdh5:cdh5-ts)), showing the DLAV at 30 hpf in inversed contrast. b A magnification of the inset in a. Arrows point to JBL. c, d Still images from a movie (Supplementary Movie 3) of a EGFP-UCHD expressing embryo (Tg(fli:Gal4ffubs3, UAS:EGFP-UCHDubs18)) showing the DLAV at 30 hpf in inversed contrast. d A magnification of the inset in c. Arrows point to JBL. e Scatter plot of quantitation of the duration of the JBL with the VE-cad-Venus transgene (n = 48 in 6 embryos) and EGFP-UCHD movies (n = 74 in 6 embryos), red line represents the median. f Quantitation of JBL angle in the DLAV in respect to the blood vessel axis (0°) using the EGFP-UCHD transgene (n = 103 from 6 embryos) or Cdh5-Venus transgene (n = 41 from 5 embryos). Scale bars 5 µm EXPRESSION / LABELING:
|
|
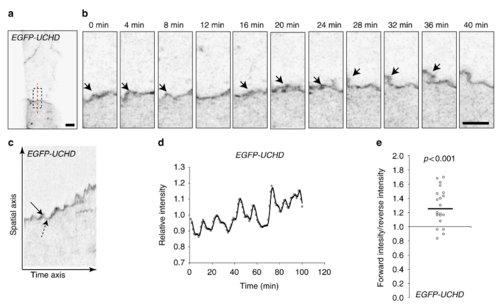
Oscillatory F-actin dynamics during remodeling of cell–cell junctions. a, b Still images from a movie (Supplementary Movie 4) showing JBL formation in the dorsal aorta of an EGFP-UCHD expressing 2dpf embryo (Tg(fli:Gal4ffubs3; UAS:EGFP-UCHDubs18)), shown in inversed contrast. b A magnification of the inset in a and the red dashed line indicates the site for kymograph in c. Arrows point to a JBL, seen as a local thickening of the junction. c Kymograph across the junction. Solid arrow denotes forward movement and dashed arrow backward movement of the junction. d Intensity plotting of a EGFP-UCHD JBL kymograph. e Scatter plot of the relative EGFP-UCHD intensity during forward and backward movements (n = 20 events, 4 movies). EGFP-UCHD intensity value in a forward movement was divided with intensity value during subsequent reverse movement. Non-parametric one sample Wilcoxon signed rank test was used as statistical test. Scale bars 5 µm EXPRESSION / LABELING:
|
|
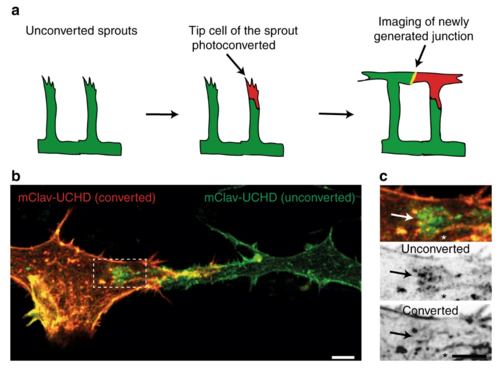
JBL formation at the distal tip of the junction during DLAV anastomosis. a Schematic representation of the mClav2-UCHD photoconversion experiment. b Image of photoconverted and unconverted mClav2-UCHD cells in the DLAV of an Tg(fli:Gal4ffubs3;UAS:mClav2-UCHDubs27) embryo, at 32 hpf. c A close up of the inset in b. Arrows point to differentially labeled JBL and asterisk (*) marks the junction outside JBL. Scale bar 5 µm EXPRESSION / LABELING:
|
|
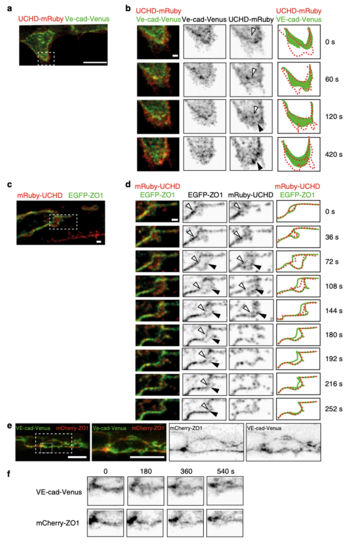
Distinct dynamics of VE-cadherin, F-actin and ZO1 during JBL formation. a, b Still images (Supplementary Movie 5) of an embryo showing the DLAV around 32 hpf in an embryo expressing both mRuby2-UCHD and VE-cad-Venus Tg(fli:Gal4ffubs3;UAS:mRuby2-UCHDubs20;BAC(cdh5:cdh5-Venus)). b A time series magnification of the inset in a. Individual channels are shown in inversed contrast. Similar observations were made in 11 movies. Open arrow head points to established junctions and black arrowhead to pioneering junction. c and d) Still images of an embryo showing DLAV around 32 hpf (Supplementary Movie 5) in an embryo expressing EGFP-ZO1 and mRuby2-UCHD (Tg(fli:Gal4ffubs3;UAS:mRuby2-UCHDubs20;UAS:EGFP-hZO1ubs5)). Imaged at rate of 12 s/stack. Similar observations were made in 9 movies. Open arrow head points to established junctions and black arrowhead to pioneering junction. e Images of endothelial cells in a VE-cad-Venus expressing embryo injected with mCherry-ZO1 encoding plasmid Tg(BAC(cdh5:cdh5-ts)); fli1ep:mCherry-ZO1)) (n = 7 embryos). f Close-up from panel e. Both channels are shown in inverted contrast. Scale bars 1 µm (b–d) and 10 µm (a, e) EXPRESSION / LABELING:
|
|
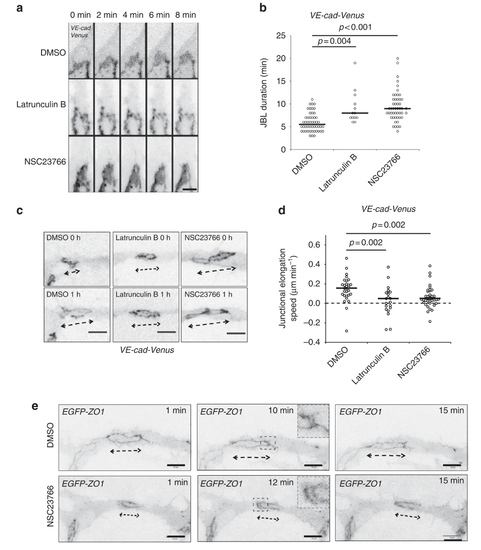
Junction elongation and JBL formation are functionally linked. a Still images from a movie of an VE-cad-Venus expressing embryo Tg(BAC(cdh5:cdh5-ts)) during anastomosis in the DLAV (around 32 hpf), in the presence of DMSO (1%), Latrunculin B (150 ng ml−1) or NSC23766 (900 µM). b Scatter plot quantitation of the duration of the JBL. DMSO, n = 50 (6 movies); Latrunculin B, n = 13 (5 movies); NSC23766, n = 49 (10 movies); black lines show median values. Non-parametric Kruskal–Wallis statistical test was used. c Confocal images of a Tg(BAC(cdh5:cdh5-ts)) embryo during junctional elongation after DLAV anastomosis. Top panels t = 0 and bottom panels after 1 h incubation. d Quantification of the junctional elongation velocity in the presence of different chemicals using Tg(BAC(cdh5:cdh5-ts)) embryos. DMSO (1%), n = 29 junctions (11 embryos); Latrunculin B (150 ng ml−1), n = 21 (6 embryos); NSC23766 (300 µM), n = 41 (11 embryos). Dotted line indicated no movement observed, black lines are medians. Non-parametric Kruskal–Wallis statistical test was used. e Confocal images of anastomosing DLAV of EGFP-ZO1 embryos (Tg(fli:Gal4ffubs3;UAS:EGFP-hZO1ubs5)) treated with DMSO or NSC23766. Scale bar 10 µm |
|
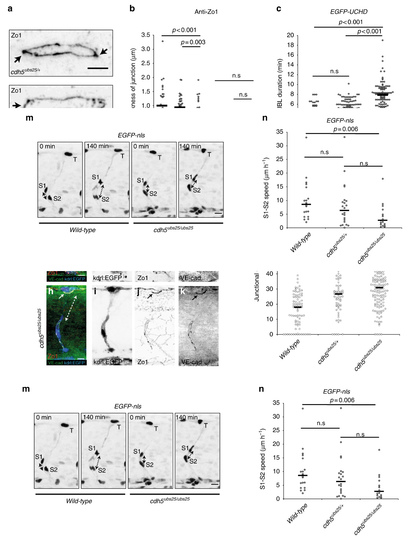
Truncation of Ve-cadherin inhibits both JBL and endothelial cell remodeling. a Images of anti-ZO1 immunostained junctions in cdh5ubs25/+ and cdh5ubs25/ubs25 embryos. Arrows point to medial site of the junction. b Quantitation of the medial and lateral junctional thickness, based on immunostaining for ZO1; cdh5ubs25/+, n = 44 junctions (17 embryos); cdh5ubs25/ubs25, n = 40 (11 embryos); wild-type n = 28 (9 embryos). Black lines are medians. Non-parametric Kruskal–Wallis statistical test was used. c Quantitation of the duration of JBL based on EGFP-UCHD signal; cdh5ubs25/+, n = 122 (8 embryos), cdh5ubs25/ubs25 n = 103 (8 embryos) and wild-type n = 43 (3 embryos). All embryos carry the UAS:EGFP-UCHD transgene Tg(fli:GFFubs3;UAS:EGFP-UCHDubs18). d–l Tg(kdrl:EGFPs843);cdh5ubs25/+ (d–g) and Tg(kdrl:EGFPs843);cdh5ubs25/ubs25 (h–k) embryos stained for VE-cadherin (rabbit antibody, green) and ZO1 (red). Individual channels are shown in inversed contrast. Both wild-type and mutant VE-cad show junctional localization (solid arrow in panels d, f, h, and j). The junctional gap in the VE-cadherin staining of a SeA in a mutant embryo (cdh5ubs25/ubs25) is marked with dashed double arrow in panel h. l Quantification of the length of junctional gaps in control (cdh5 ubs25/+, n = 72 gaps, 23 embryos) and mutant (cdh5ubs25/ubs25, n = 139 gaps, 33 embryos) embryos. Black lines are medians. Non-parametric Mann–Whitney statistical test was used. m Still images from a confocal time-lapse of endothelial nuclei (Tg; kdrl:nlsEGFPubs1) in wild-type or cdh5ubs25/ubs25 embryos during SeA formation. T tip cell, S1 stalk cell 1, S2 stalk cell 2; double-headed arrow indicates the distance of S1 and S2 nuclei. n Quantification of movement of stalk cell 1 (S1) nuclei in relation to stalk cell 2 (S2) nuclei during cell rearrangements in SeA; cdh5ubs25/+, n = 22 SeA (4 embryos); cdh5ubs25/ubs25, n = 17 SeA (4 embryos); wild-type n = 20 SeA (4 embryos). Black lines are medians. Non-parametric Kruskal–Wallis statistical test was used. Scale bars 5 µm (a), 10 µm (d, h, m) |

ZFIN is incorporating published figure images and captions as part of an ongoing project. Figures from some publications have not yet been curated, or are not available for display because of copyright restrictions. |

