Fig. 1
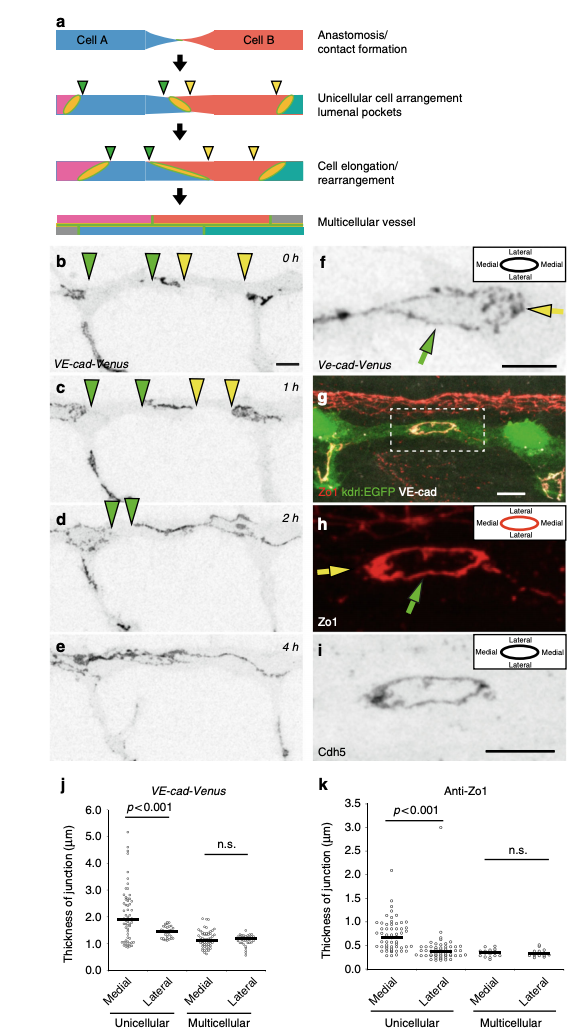
Polarized thickness in remodeling junctions. a Schematic model of cellular rearrangements during formation and maturation of dorsal longitudinal anastomosing vessel (DLAV) in zebrafish. At first, the tip cells (Cell A and B) of two anastomosing endothelial sprouts contact and form a de novo junction. Next, a vessel with unicellular architecture is formed, where junctions are not interconnected but are visible as separate rings. Then, through cellular rearrangement and elongation, the junctions elongate along vessel axis until junctions are interconnected and vessel reaches the final multicellular architecture. The edges of the junctional gaps in the unicellular vessels are marked with green and yellow triangles. b–e Still pictures of a time-lapse movie (Supplementary Movie 1) showing EC junctions of Tg(BAC(cdh5:cdh5-ts)) embryo, which expresses VE-cad-Venus fusion protein, during transition from unicellular to multicellular vessel during DLAV formation, in inversed contrast starting around 28 hpf. The edges of the junctional gaps in the unicellular vessels are marked with green and yellow triangles. f Close-up image of VE-cad-Venus embryos. The diffuse thickening of medial domain of the junction is marked with a yellow arrow. g–iWhole-mount immunofluorescence staining of the DLAV using anti-ZO1, anti-VE-cad (rat) of 28–30 hpf (Tg(kdrl:EGFPs843)) embryos. h The yellow arrow points to the medial junctional domain and the green arrow to the lateral junctional domain. j Quantification of junctional thickness measurements. n = 44 unicellular junctions and 48 multicellular junctions from 5 VE-cad-Venus Tg(BAC(cdh5:cdh5-ts)) embryos. Non-parametric Kruskal–Wallis test was used. k Quantification of the junctional thickness measurements from immunostainings of Tg(kdrl:EGFPs843) embryos. n = 58 unicellular junctions and 17 multicellular junctions from 8 embryos. Non-parametric Kruskal–Wallis test was used. Scale bars 10 µm

