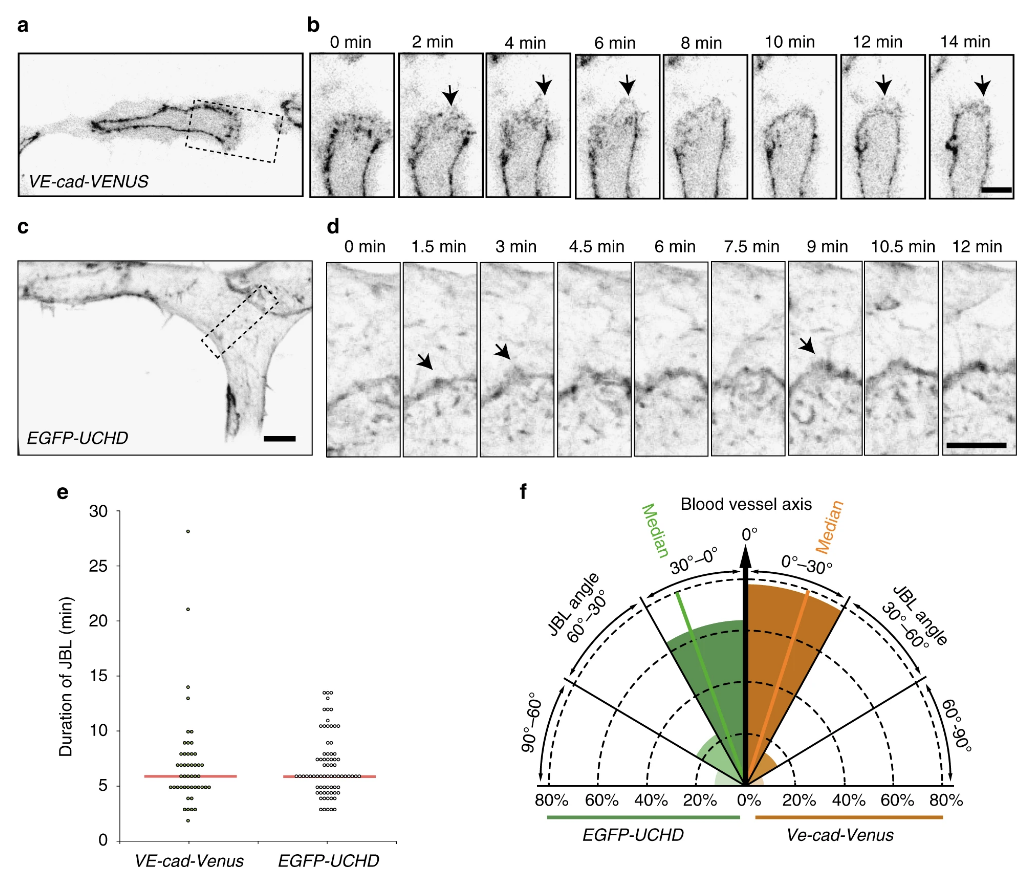
Fig. 2 Active VE-cad and F-actin behavior of junction-based lamellipodia. a, b Still images from a movie (Supplementary Movie 2) of a VE-cad-Venus expressing embryo Tg(BAC(cdh5:cdh5-ts)), showing the DLAV at 30 hpf in inversed contrast. b A magnification of the inset in a. Arrows point to JBL. c, d Still images from a movie (Supplementary Movie 3) of a EGFP-UCHD expressing embryo (Tg(fli:Gal4ffubs3, UAS:EGFP-UCHDubs18)) showing the DLAV at 30 hpf in inversed contrast. d A magnification of the inset in c. Arrows point to JBL. e Scatter plot of quantitation of the duration of the JBL with the VE-cad-Venus transgene (n = 48 in 6 embryos) and EGFP-UCHD movies (n = 74 in 6 embryos), red line represents the median. f Quantitation of JBL angle in the DLAV in respect to the blood vessel axis (0°) using the EGFP-UCHD transgene (n = 103 from 6 embryos) or Cdh5-Venus transgene (n = 41 from 5 embryos). Scale bars 5 µm
Image
Figure Caption
Figure Data
Acknowledgments
This image is the copyrighted work of the attributed author or publisher, and
ZFIN has permission only to display this image to its users.
Additional permissions should be obtained from the applicable author or publisher of the image.
Full text @ Nat. Commun.

