- Title
-
Ethanol Exposure Causes Muscle Degeneration in Zebrafish
- Authors
- Coffey, E.C., Pasquarella, M.E., Goody, M.F., Henry, C.A.
- Source
- Full text @ J Dev Biol
|
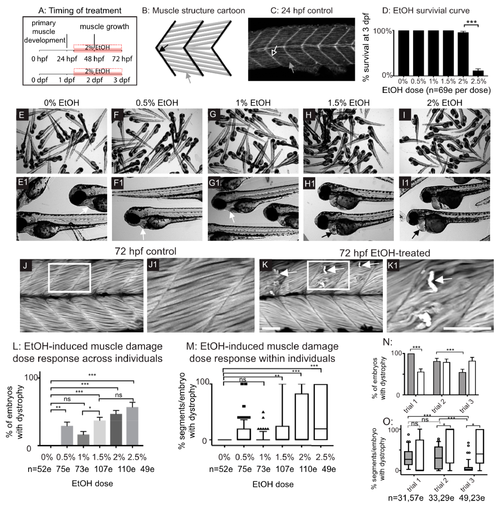
Late embryonic exposure to EtOH causes muscle damage in zebrafish. (A) Zebrafish muscle development timeline showing that 2% EtOH was administered after primary muscle development is complete. (B) Cartoon showing zebrafish muscle structure. Elongated myofibers (gray arrow) attach at the myotendinous junction (MTJ) (black arrow). (C) Control embryo. Muscle fibers have elongated (gray arrow) and attached to the MTJ (black arrow outlined in white) by 24 hpf. (D) Quantification of survival at 72 hpf following continuous treatment with one of six different doses of EtOH from 30 to 72 hpf. (E–I1) Brightfield images of 72 hpf zebrafish treated with one of six different doses of EtOH. Numbered panels are higher magnification images of zebrafish treated with the same EtOH dose as the corresponding lettered panels. (E–E1) 0% EtOH. Note normal heart morphology (E1, white arrow). (F–F1) 0.5% EtOH. Note normal heart morphology (F1, white arrow). (G–G1) 1% EtOH. Note normal heart morphology (G1, white arrow). (H–H1) 1.5% EtOH. Note pericardial edema (H1, black arrow). (I–I1) 2% EtOH. Note pericardial edema (I1, black arrow). (J–K1) Anterior left, dorsal-top, side-mounted, 72 hpf embryos stained with phalloidin (white) to visualize actin. White boxes in J and K correspond to zoomed-in, numbered panels J1 and K1, respectively. (J–J1) Control embryo. Muscle fibers remain attached to the MTJ. (K–K1) Embryo treated continuously with 2% EtOH from 30 to 72 hpf. White arrows indicate muscle fibers that have detached from the MTJ. (L) Quantification of the percent of EtOH-treated embryos at each of the EtOH treatment doses that displayed one or more fiber detachments. (M) Quantification of the percent of imaged segments with fiber detachments per embryo across the six different EtOH treatment doses. (N–O) Quantification of the variability in EtOH-induced fiber detachments across experimental replicates. (N) Percent of EtOH-treated embryos with at least one fiber detachment across three trials with either 2% EtOH diluted from 95% stock (gray bars) or 2% EtOH diluted from 100% stock (white bars). (O) Percent of imaged segments per embryo with fiber detachments across three trials with either 2% EtOH diluted from 95% stock (gray boxes) or 2% EtOH diluted from 100% stock (white boxes). Note the persistence of variability in muscle damage across three trials regardless of EtOH stock solution used. Scale bars are 50 micrometers. “e” = embryo. Error bars are standard error of the mean and whiskers are 10th–90th percentiles. * p < 0.05, ** p < 0.01, *** p < 0.001.
PHENOTYPE:
|
|
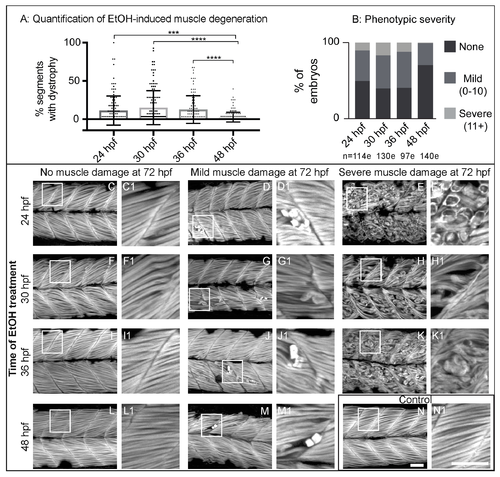
Zebrafish muscle is less sensitive to EtOH administered later in development. (A) Quantification of the percent of imaged segments with fiber detachments per embryo. 2% EtOH treatment from 48 to 72 hpf caused significantly fewer segments with fiber detachments per embryo compared to EtOH treatment beginning at 24, 30, or 36 hpf. (B) Quantification of the percent of embryos at each of the four EtOH treatment time points that fell into each of the three phenotype bins. (C–N) Anterior left, dorsal top, side-mounted, 72 hpf embryos stained with phalloidin (white) to visualize actin. Embryos treated continuously with 2% EtOH from 24 hpf, 30 hpf, 36 hpf, or 48 hpf through 72 hpf showed a spectrum of muscle damage severity that was binned into one of three groups: None (0 segments per embryo with dystrophy), Mild (1–10 segments per embryo with dystrophy), or Severe (11+ segments per embryo with dystrophy). White boxes correspond to zoomed-in, numbered panels. (C–E1) Embryos continuously treated with 2% EtOH between 24 and 72 hpf showed no muscle damage (C–C1), mild damage (D–D1), or severe damage (E–E1). (F–H1) Embryos continuously treated with 2% EtOH between 30 and 72 hpf showed no muscle damage (F–F1), mild damage (G–G1), or severe damage (H–H1). (I–K1) Embryos continuously treated with 2% EtOH between 36 and 72 hpf showed no muscle damage (I–I1), mild damage (J–J1), or severe damage (K–K1). (L–M1) Embryos continuously treated with 2% EtOH between 48 and 72 hpf showed no muscle damage (L–L1) or mild damage (M–M1). (N–N1) Control embryo. Scale bars are 50 micrometers. “e” = embryo. Error bars are standard error of the mean. *** p < 0.001, **** p < 0.0001.
PHENOTYPE:
|
|
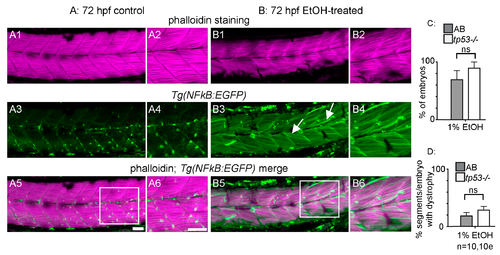
NF-kB-dependent inflammation is present, but p53-dependent apoptosis is not required for EtOH-induced fiber detachments. (A1–B6) Anterior left, dorsal top, side-mounted 72 hpf Tg(NF-kB:EGFP) embryos stained with phalloidin (pseudo-colored fuchsia) to visualize actin. (A1–6) 72 hpf Tg(NF-kB:EGFP) control embryo. (A1–2) Phalloidin channel only. (A2) Zoomed-in view corresponds to white box in A5. (A3–4) GFP channel only. (A4) Zoomed-in panel corresponds to white box in A5. Note low NF-kB activity in muscle fibers. (A5) Phalloidin and NF-kB-EGFP channels merged. (A6) Zoomed-in panel corresponds to white box in A5. (B1–6) 72 hpf Tg(NF-kB:EGFP) embryo treated continuously with 2% EtOH from 30 to 72 hpf. (B1–2) Phalloidin channel only. (B2) Zoomed-in view corresponds to white box in B5. (B3–4) GFP channel only. (B4) Zoomed-in view corresponds to white box in B5. Note increased NF-kB activity in muscle fibers due to EtOH exposure. White arrows points to muscle fibers expressing GFP. (B5–6) Phalloidin and NF-kB-EGFP channels merged. (B6) Zoomed-in view corresponds to white box in B5. (C–D) Quantification of fiber detachment frequency within and between AB or tp53 mutant embryos treated with EtOH from 30 to 72 hpf. (C) Percent of EtOH-treated embryos displaying one or more fiber detachments. There was no significant difference in fiber detachment frequency between embryos depending on AB (gray bars) vs. tp53 mutant (white bars) genetic background at 1% EtOH. (D) Percent of imaged segments with fiber detachments per embryo. There was no significant difference in fiber detachment frequency within embryos depending on AB (gray bars) vs. tp53 mutant (white bars) genetic background at 1% EtOH. Scale bars are 50 micrometers. “e” = embryo. Error bars are standard error of the mean.
EXPRESSION / LABELING:
PHENOTYPE:
|
|
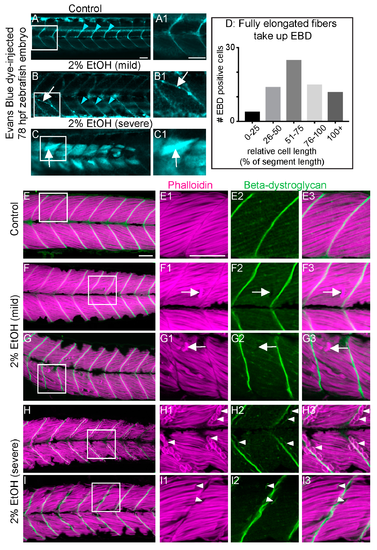
EtOH-induced fiber detachments result from sarcolemmal instability and failure of muscle end attachments. (A–C1) Anterior left, dorsal top, side-mounted, live, 78 hpf embryos treated continuously with 2% EtOH from 30 to 72 hpf, injected with 1% Evans Blue Dye (EBD) (pseudocolored blue) at 72 hpf. White boxes in A, B, and C correspond to zoomed-in, numbered panels A1, B1, and C1, respectively. (A–A1) Control embryo. EBD is in the blood stream (blue arrowheads). (B–B1) Embryo with mild fiber detachment phenotype that was induced by continuous treatment of 2% EtOH from 30 to 72 hpf. EBD is in the blood stream (blue arrowheads). EBD permeates some long muscle fibers (white arrows in B and B1). (C–C1) Embryo with severe fiber detachment phenotype that was induced by continuous treatment of 2% EtOH from 30 to 72 hpf. EBD is in the blood stream (blue arrowheads). EBD permeates long (white arrows in C and C1) and short muscle fibers. (D) Quantification of the relative length of EBD-penetrated myofibers. EBD penetrated myofibers ranging from short, retracted fibers to fully elongated, diagonally arrayed, fast-twitch myofibers in EtOH-treated embryos. (E–I3) Anterior left, dorsal top, side-mounted, 72 hpf embryos stained with phalloidin (pseudo-colored fuchsia) to visualize actin and anti-beta-DG antibodies (green). Lettered panels show phalloidin and beta-DG channels merged. White boxes correspond to numbered panels on the right. Panels numbered 1 show zoomed-in images of phalloidin staining only. Panels numbered 2 show zoomed-in images of beta-DG staining only. Panels numbered 3 show zoomed-in images of phalloidin and beta-DG channels merged. (E–E3) Control embryo. Fibers remained long and beta-DG is localized to the MTJ. (F–G3) Embryos treated continuously with 2% EtOH from 30 to 72 hpf showing mild fiber detachment. White arrowheads in F1–F3 and G1–G3 point to retracted fibers unaccompanied by beta-DG. (H–I3) Embryos treated continuously with 2% EtOH from 30 to 72 hpf with severe fiber detachment. White arrowheads in H1–H3 and I1–I3 point to retracted fibers that retained beta-DG at their detached ends. Scale bar is 50 micrometers.
PHENOTYPE:
|
|
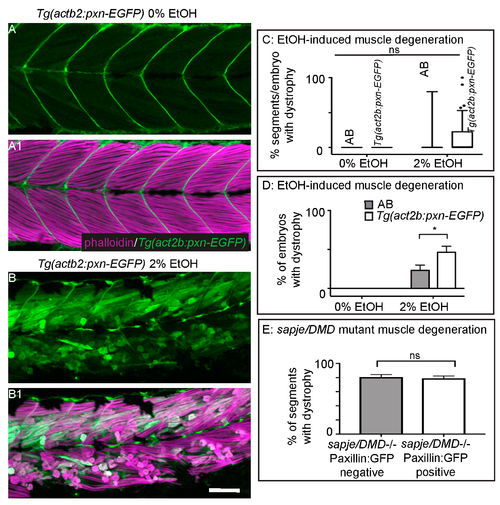
Paxillin overexpression does not rescue fiber detachments caused by loss of sarcolemmal integrity. (A–B1) Anterior left, dorsal top, side mounted, 72 hpf Tg(act2b:pxn-EGFP) embryos overexpressing Paxillin-EGFP (green) stained with phalloidin (pseudocolored fuchsia) to visualize actin. (A–A1) Tg(act2b:pxn-EGFP) control embryo. Fibers remain long and Paxillin-EGFP localizes to the MTJ. (A) GFP channel only. (A1) Phalloidin and GFP channels merged. (B–B1) Tg(act2b:pxn-EGFP) embryo treated continuously with 2% EtOH from 30 to 72 hpf. Fibers detach from the MTJ. (B) GFP channel only. (B1) Phalloidin and GFP channels merged. (C) Quantification of the percentage of imaged segments/embryo that had EtOH-induced dystrophy. Embryos that constitutively overexpressed Paxillin-EGFP (n = 53e) had more segments with fiber detachments compared to AB embryos (n = 54e) after continuous treatment with 2% EtOH. (D) Quantification of percent of embryos with EtOH-induced fiber detachments. Fiber detachment frequency was significantly greater in embryos that constitutively overexpressed Paxillin-EGFP compared to AB embryos after continuous treatment with 2% EtOH. (E) Quantification of the proportion of imaged segments/embryo with dystrophy. sapje mutants that constitutively overexpressed Paxillin-EGFP (white bars) (n = 28e) showed no significant difference in the percent of segments that contained fiber detachments compared to those that did not constitutively overexpress Paxillin-EGFP (gray bars) (n = 23e) (p = 0.11). These data suggest that Paxillin overexpression does not reduce fiber detachments due to loss of sarcolemmal integrity. Scale bars are 50 micrometers. Error bars are standard error of the mean. * p < 0.05.
PHENOTYPE:
|
|
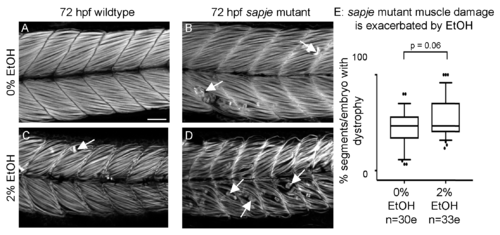
EtOH exacerbates dystrophy in sapje mutants. (A–D) Anterior left, dorsal top, side-mounted, 72 hpf embryos stained with phalloidin (white) to visualize actin. (A) Wildtype control embryo. Muscle fibers are attached to the MTJ. (B) sapje mutant control embryo. A few muscle fibers detach from the MTJ (white arrows). (C) Wildtype embryo treated continuously with 2% EtOH from 30 to 72 hpf. A few muscle fibers detach from the MTJ (white arrow). (D) sapje mutant embryo treated continuously with 2% EtOH from 30 to 72 hpf. Note the increased number of muscle fibers detached from the MTJ (white arrows). (E) Quantification of fiber detachment frequency in sapje mutant embryos without and with EtOH exposure. sapje mutant embryos that were treated continuously with 2% EtOH showed an average increase in fiber detachments per embryo (p = 0.06). “e” = embryo. Whiskers are 10th–90th percentiles.
PHENOTYPE:
|

ZFIN is incorporating published figure images and captions as part of an ongoing project. Figures from some publications have not yet been curated, or are not available for display because of copyright restrictions. PHENOTYPE:
|

