- Title
-
Dusp6 attenuates Ras/MAPK signaling to limit zebrafish heart regeneration
- Authors
- Missinato, M.A., Saydmohammed, M., Zuppo, D.A., Rao, K.S., Opie, G.W., Kühn, B., Tsang, M.
- Source
- Full text @ Development
|
dusp6 is induced upon cardiac injury and expressed in cardiomyocytes and endothelial cells. (A) Q-PCR analysis of dusp6 in adult zebrafish hearts at 1 and 7 days post amputation (dpa), compared with uninjured hearts. dusp6 is induced after ventricle apex amputation. Values are normalized to β-actin and rnap expression. Data represent three independent replicates. *P<0.05, one-way ANOVA. (B) dusp6 expression in uninjured hearts and at 3 dpa using RNAscope. In uninjured hearts, dusp6 (red) is weakly detected throughout the heart including endothelial cells [Tg(fli1a:EGFP)y1], myocardium (Myo) and compact myocardium (CM). At 3 dpa, dusp6 expression was detected in the myocardium and in endothelial cells. Dotted line demarcates the amputation plane. Sections were counterstained with DAPI (blue) to visualize nuclei. Boxed areas are magnified beneath. (C) Confocal image from Tg(dusp6:memGFP)pt21 heart immunostained with anti-GFP and anti-Mef2C, showing that cardiomyocytes express memGFP in uninjured hearts. (D) AFOG images (left) and confocal images (center and right) of Tg(dusp6:memGFP)pt21; Tg(kdrl:NLS:mCherry)is5 hearts at multiple time points after ventricle apex amputation (n=3 for each time point). memGFP is expressed in the vessels of the compact myocardium in uninjured hearts and in the nascent vessels inside the clot after injury. Sections were counterstained with DAPI (blue) to visualize nuclei. Scale bars: 100 µm. |
|
dusp6 mutant hearts exhibit mild cardiomegaly. (A) The TALENs targeting dusp6 exon 1. (B) Recovery of dusp6 mutant alleles pt30a-d. Mismatches created by the 1 bp insertion in pt30d are indicated in red. (C) Predicted amino acid sequence of dusp6pt30 alleles. (D) Western blot showing absence of Dusp6 protein in dusp6pt30a/pt30a embryos. β-actin was used as a loading control. (E,F) Whole-mount images of uninjured WT (E) and dusp6pt30a/pt30a (F) hearts at 5 months of age. dusp6 mutant hearts show cardiomegaly. A, atrium; V, ventricle; BA, bulbus arteriosus. (G) Quantification of the ratio of ventricle area/body weight (VA/BW) in WT (n=5) and dusp6 mutant (n=5) fish. dusp6pt30a/pt30a fish have a larger VA/BW ratio than WT fish. **P<0.01, Student's t-test. (H,I) AFOG staining of uninjured heart sections at 5 months of age. dusp6 mutant hearts (I) have a thicker compact myocardium (brackets) than WT hearts (H). (J) Quantification of compact myocardium thickness in uninjured hearts at 5 months of age for WT (n=4) and dusp6 mutant (n=5). ****P<0.0001, Student's t-test. (K,L) Sections of uninjured WT (n=4) and dusp6 mutant (n=4) fish with the Tg(fli1a:EGFP)y1 background to visualize the endothelium. dusp6 mutant hearts (L) have a thicker compact myocardium (red arrows) containing more vessels than WT hearts (K). (M,N) pERK is detected in fli1a:EGFP+ vessels of the compact myocardium. dusp6 mutant hearts (n=4) (N) have a thicker compact myocardium with more vessels showing pERK staining than in WT uninjured hearts (n=4) (M). Scale bars: 100 µm. |
|
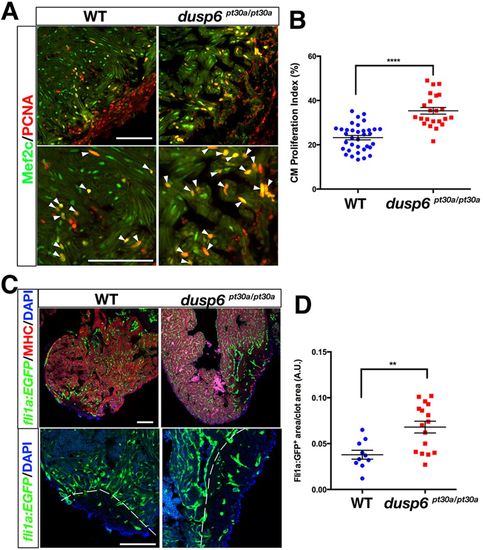
Increased cardiomyocyte proliferation and angiogenesis in dusp6 mutant hearts after cardiac injury. (A) Hearts at 7 dpa, immunostained for Mef2c (green; cardiomyocyte nuclei) and Pcna (red; proliferation marker). Cardiomyocyte proliferation is increased in dusp6 mutant hearts (n=23) compared with WT hearts (n=35). Arrowheads indicate proliferating cardiomyocytes. (B) Quantification of cardiomyocyte proliferation index in WT and dusp6 mutant hearts. ****P<0.0001, Student's t-test. (C) EGFP+ vessels were visualized in Tg(fli1a:EGFP)y1; dusp6pt30a/pt30a (n=16) and Tg(fli1a:EGFP)y1 (n=10) hearts at 8 dpa. Dashed line demarcates the resection plane. (D) Quantification of new vessels formed inside the clot area of hearts at 8 dpa. **P<0.01, Student's t-test. Scale bars: 100 µm. |
|
dusp6 mutant hearts show accelerated regeneration. (A,B) Sections of hearts at 20 dpa stained with AFOG to visualize the deposition of fibrotic tissue (arrows). dusp6 mutant hearts (n=13) (B) have reduced fibrotic tissue area compared with WT hearts (n=17) (A). (C) Quantitation of fibrotic tissue area at 20 dpa. ***P<0.001, Student's t-test. (D) Representative ECG from WT (n=25) and dusp6 mutants (n=24) at 20 dpa. dusp6 mutant fish exhibit fewer arrhythmic events than WT. ECG are shown from four fish (#1, #10, #11, #13). (E) Quantitation of the arrhythmic events, measured as R-R intervals, in WT and dusp6pt30a/pt30a zebrafish at 20 dpa. ****P<0.0001, Student's t-test. (F) RNA-seq analysis of uninjured hearts and hearts at 20 dpa. At 20 dpa, WT hearts express fibrosis genes, but in dusp6pt30a hearts fibrosis genes are downregulated, suggesting faster regeneration. (G) Q-PCR analysis of selected fibrosis genes in hearts at 20 dpa. dusp6pt30a hearts show downregulation of fibrosis genes. Values are normalized to β-actin and rnap expression. Data are from one representative experiment from three independent biological replicates. |
|
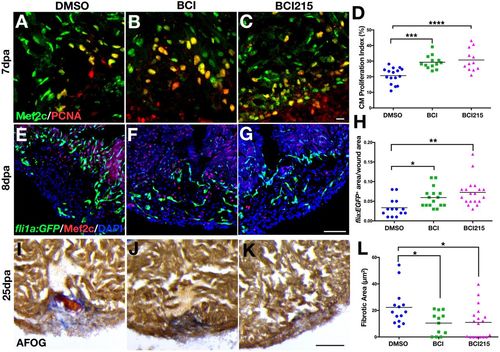
Chemical inhibition of Dusp6 increases cardiomyocyte proliferation and angiogenesis and reduces fibrosis after cardiac injury. (A-C) Adult zebrafish hearts at 7 dpa, injected for 6 days with DMSO (n=16) (A), 0.5 mg/kg BCI (n=13) (B) or 0.5 mg/kg BCI215 (n=12) (C) and stained for Mef2c and Pcna. (D) Quantification of proliferating cardiomyocytes at 7 dpa. BCI and BCI215 increased cardiomyocyte proliferation compared with DMSO vehicle. (E-G) Tg(fli1a:EGFP)y1 hearts at 8 dpa injected for 6 days with BCI (n=16) (F), BCI215 (n=19) (G) or DMSO (n=14) (E) and stained for Mef2c. (H) Quantification of new vessels formed inside the clot area of hearts at 8 dpa. (I-K) Sections of hearts at 25 dpa stained with AFOG to visualize the scar. Intact cardiac muscle stains orange-brown, fibrin stains red and collagen blue. Fish injected with BCI (n=12) (J) and BCI215 (n=18) (K) resolved the injury faster than DMSO-injected fish (n=14) (I). (L) Quantification of clot areas at 25 dpa. (D,H,L) ****P<0.0001, ***P<0.001, **P<0.01, *P<0.05, one-way ANOVA. Scale bars: 100 µm. |
|
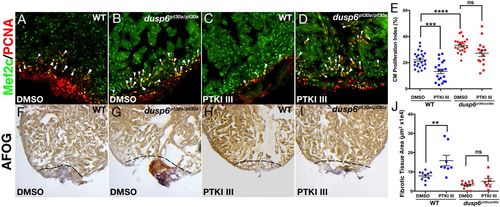
dusp6 mutant hearts are mildly affected by PDGFR inhibition. (A-D) Hearts at 7 dpa were injected for 6 days with PTKI III (C,D) or vehicle DMSO (A,B) and stained for Mef2c and Pcna to determine cardiomyocyte proliferation. WT hearts (DMSO, n=22; PTKI III, n=19) (A,C) and dusp6pt30a/pt30a hearts (DMSO, n=21; PTKI III, n=15) (B,D). Arrowheads indicate proliferating cardiomyocytes. (E) Quantification of cardiomyocyte proliferation in WT and dusp6 mutant hearts after injection of PTKI III or DMSO. Each point represents the average proliferation index from one heart. (F-I) AFOG staining of WT or dusp6pt30a/pt30a hearts at 20 dpa injected for 6 days with PTKI III (WT, n=8; dusp6pt30a/pt30a, n=12) (H,I) or DMSO (WT, n=10; dusp6pt30a/pt30a, n=7) (F,G). Dashed line demarcates injury zone. (J) Quantification of fibrotic tissue area in hearts at 20 dpa. (E,J) ****P<0.0001, ***P<0.001, **P<0.01; ns, not significant; one-way ANOVA. |
|
EGF receptor inhibition in dusp6 mutants dampens cardiac regeneration. (A) Q-PCR analysis of errfi1b at 0 and 3 dpa. After amputation, dusp6 mutant hearts show higher errfi1b expression compared with WT. Data represent six independent replicates. (B-E) Hearts at 7 dpa injected for 6 days with AG1478 (C,E), or DMSO vehicle (B,D) and stained for Mef2c and Pcna to determine cardiomyocyte proliferation. Arrowheads indicate proliferating cardiomyocytes. For WT: DMSO, n=36; 10 µM and 25 µM AG1478, n=17 and n=14, respectively. For dusp6pt30a/pt30a: DMSO, n=31; 10 µM and 25 µM AG1478, n=19 and n=13, respectively. (F) Quantification of cardiomyocyte proliferation in WT and dusp6 mutant hearts after injection of AG1478 or DMSO. (G-J) Tg(fli1a:EGFP)y1 hearts at 8 dpa injected with AG1478 (H,J) or DMSO (G,I). MHC (red) marks the resection plane. AG1478 treatment blocked angiogenesis in WT hearts, but not in dusp6 mutant hearts. Dashed line demarcates resection plane. n=17 for DMSO in WT and dusp6pt30a/pt30a; n=7 for 25 µM AG1478 in WT and dusp6pt30a/pt30a. (K) Quantification of new vessels formed at 8 dpa. (L) Quantification of cardiomyocyte proliferation in erbb2st61/+ hearts at 7 dpa, injected with BCI215 (n=13) or DMSO (n=14) as compared with sibling WT hearts (DMSO, n=17). erbb2st61/+ hearts have a diminished cardiomyocyte proliferation index compared with WT hearts, and this is rescued by BCI215. (A,F,K,L) ****P<0.0001, ***P<0.001, *P<0.05; ns, not significant; one-way ANOVA. Scale bars: 100 µm. |
|
Dusp6 is expressed in cardiomyocytes of the adult heart. dusp6 (red) transcripts are detected in uninjured hearts and in 7dpa hearts using RNAscope. In uninjured and 7dpa hearts, dusp6 is detected throughout the heart and in cardiomyocytes as determined by Mef2c expression. EXPRESSION / LABELING:
|
|
dusp6 mutant heart are larger and have a thicker compact myocardium containing more vessels than WT hearts (A) Quantification of compact myocardium thickness in uninjured hearts at 3 and 5 months of age in WT and dusp6 mutant (n≥4 for each group). At 5 months of age dusp6 mutant fish have thicker compact myocardium than WT hearts. ****p<0.0001; ns= not significant. One-way ANOVA. (B) 3 months old uninjured zebrafish hearts immunostained for Mef2c (green; cardiomyocyte nuclei) and PCNA (red; proliferation marker). dusp6 heart (n=5) have more proliferating cardiomyocyte than WT hearts (n=5). (C) Quantification of cardiomyocyte proliferation in WT and dusp6 mutant hearts at 3 and 5 months of age (n=5 for each group). **p<0.01; ns= not significant. One-way ANOVA. (D) Uninjured hearts sections stained for MHC to visualize cardiomyocyte and wheat germ agglutinin (WGA) to stain cell membrane. (E) Quantification of cardiomyocyte size in uninjured hearts. dusp6 mutant hearts (n=9) have the same size of cardiomyocyte compared to WT (n=11); Student’s t-test. n.s.=not significant. (F) Quantification of vessels area per compact myocardium area in uninjured hearts at 5 months of age WT (n=4) and dusp6 mutant (n=4). **p<0.01. Student’s t-test. Scale bars, 100 μm. |
|
dusp6 mutant hearts have increased pERK (A) Cryosections of uninjured Tg(fli1a:EGFP)y1 zebrafish hearts immunostained for pERK. dusp6 heart (n=9) have increased pERK staining than WT hearts (n=10). Images are from one representative hearts for each group. Non-consecutive sections (S) are shown. S-2 is an initial section, in proximity of the compact myocardium. S-12 is the central section of the heart. (B) Quantification of pERK in WT and dusp6 mutant hearts at 5 months of age. pERK staining was calculated as sum of pERK+ immunostained area divided by the compact myocardium area, and expressed as percentage. ***p<0.001. Student’s t-test. Scale bars, 100 μm. |
|
dusp6pt30d/pt30d hearts show the same phenotype as dusp6pt30a/pt30a (A) Whole-mount images of adult WT (n=32), dusp6pt30a/pt30a (n=32), and dusp6pt30d/pt30d (n=19) hearts at 7 dpa. dusp6 mutant hearts show cardiomegaly. A=Atrium; V=Ventricle; BA=Bulbus Arteriosus (B) Quantification of the ratio ventricle area/body weight (VA/BW). dusp6 mutant fish exhibit larger VA/BW than WT fish. ****p<0.0001; n.s.=not significant. One-way ANOVA. (C) Zebrafish hearts at 7 dpa, immunostained for Mef2c and PCNA. dusp6pt30a/pt30a (n=29) and dusp6pt30d/pt30d heart (n=14) show increased cardiomyocyte proliferation compared to WT hearts (n=33). (D) Quantification of cardiomyocyte proliferation index. ****p<0.0001. n.s.=not significant. One-way ANOVA. Scale bars, 100 μm. PHENOTYPE:
|
|
dusp6 mutant hearts show increased cardiomyocyte proliferation after injury, but it is not indeterminate. (A) Hearts at 0- (WT n=24; dusp6pt30a/pt30a n=28), 4- (WT n=7; dusp6pt30a/pt30a n=7), 7- (WT n=11; dusp6pt30a/pt30a n=8) 12- (WT n=7; dusp6pt30a/pt30a n=5), and 20 dpa (WT n=13; dusp6pt30a/pt30a n=10) immunostained for Mef2c and PCNA. dusp6 mutant hearts show increased proliferating cardiomyocytes at 4- and 7 dpa, but the proliferation index at 12- and 20 dpa is similar to WT hearts. (B) Graph representing the cardiomyocyte proliferation index at multiple time point between WT and dusp6 hearts. ****p<0.0001; n.s.=not significant. One-way ANOVA. Scale bars, 100 μm. |
|
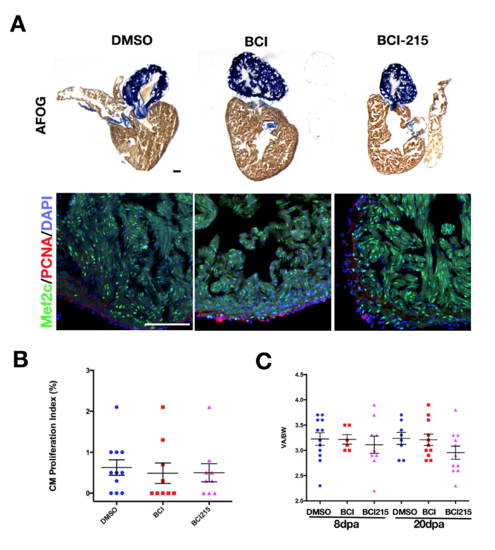
BCI and BCI215 do not affect cardiomyocyte proliferation or cardiac size in uninjured hearts. (A) Cryosections of uninjured hearts injected for 6 days with DMSO (n=11), BCI (n=9) or BCI215 (n=9), stained for AFOG (top) and for Mef2c and PCNA (bottom). (B) Quantification of cardiomyocyte proliferation in uninjured hearts injected with BCI, BCI215, or vehicle DMSO. (C) Graph representing the ratio of ventricle area and fish body weight (VA/BW) in samples at 8 dpa injected for 6 days with DMSO (n=12), BCI (n=6), or BCI215 (n=9), and samples at 20 dpa injected for 6 days with DMSO (n=8), BCI (n=11), or BCI215 (n=11). BCI and BCI215 compounds do not cause cardiomegaly. n.s.=not significant. One-way ANOVA. Scale bars, 100 μm. |
|
BCI215 is specific for Dusp6 (A) Cryosections of WT and dusp6pt30a/+ hearts at 7 dpa injected for 6 days with DMSO (WT n=33; dusp6pt30a/+ n=17), or 0.25 mg/Kg of BCI215 (WT n=7; dusp6pt30a/+ n=11), stained for Mef2c and PCNA. (B) Quantification of cardiomyocyte proliferation in hearts injected with BCI215, or vehicle DMSO. Sub-optimal dose of BCI215 does not affect cardiomyocyte proliferation in WT hearts, but increases cardiomyocyte proliferation in dusp6pt30a/+ hearts. **p<0.01; n.s.=not significant. One-way ANOVA. (C) Cryosections of WT and dusp6pt30a/+ hearts at 7 dpa injected with DMSO (WT n=25; dusp6pt30a/+ n=15), or 0.5 mg/Kg of BCI215 (WT n=21; dusp6pt30a/+ n=8), stained for Mef2c and PCNA. (D) Quantification of cardiomyocyte proliferation. Optimal dose of BCI215 increases cardiomyocyte proliferation in WT hearts but it does not affect cardiomyocyte proliferation in dusp6pt30a/+ hearts ****p<0.0001; n.s.=not significant. One-way ANOVA. Scale bars, 100 μm. |
|
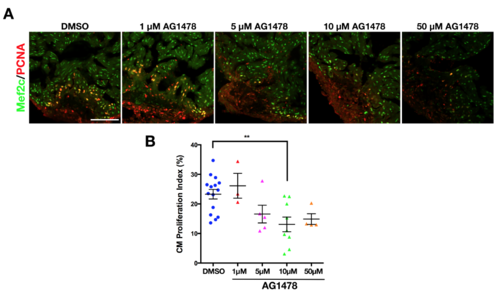
EGFR inhibition blocks cardiomyocyte proliferation in WT hearts (A) Dose response of AG1478 in WT hearts on cardiomyocyte proliferation. Mef2c and PCNA immunostaining in WT hearts at 7 dpa injected with DMSO (n=15), 1 μM (n=3), 5 μM (n=5), 10 μM (n=9), and 50 μM (n=4) of AG1478. (B) Quantification of cardiomyocyte proliferation after injection of AG1478. 5, 10 and 50 μM of AG1478 reduced cardiomyocyte proliferation in WT hearts. **p<0.01 One-way ANOVA. Scale bars, 100 μm. |
|
AG1478 blocks heart regeneration in WT hearts, but not in the dusp6 mutant hearts. (A-D) Sections of hearts at 20 dpa stained with AFOG to visualize the deposition of fibrotic tissue. AG1478 treated WT hearts (B) (n=6) show larger area of fibrotic tissue when compared to DMSO control treatments (A) (n=9). However, AG1478 did not result in suppressing heart regeneration in dusp6pt30a/pt30a mutants (D) (n=9), compared to DMSO (C) (n=9). (E) Graph showing the measurements of fibrotic tissue areas at 20 dpa. **p<0.01, *p<0.05; n.s.=not significant. One-way ANOVA. Scale bars, 100 μm. PHENOTYPE:
|

Unillustrated author statements PHENOTYPE:
|


