- Title
-
glucagon is essential for alpha cell transdifferentiation and beta cell neogenesis
- Authors
- Ye, L., Robertson, M.A., Hesselson, D., Stainier, D.Y., Anderson, R.M.
- Source
- Full text @ Development
|
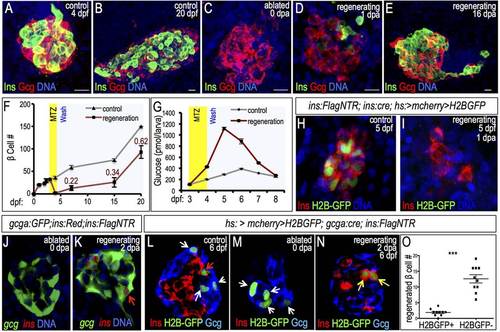
β cell neogenesis from α cell transdifferentiation in zebrafish. (A-E) Confocal projections showing α (red) and β (green) cells in the principal islet of intact (A,B) and ablated (C-E) Tg(ins:CFP-NTR) larvae at 0, 1 and 16days post ablation (dpa). Scale bars: 10 µm. (F) Quantification of insulin+ cells in intact (gray line) and regenerating (red line) islets from 0 to 20dpf (ne3 for all groups except control 20dpf, n=1). The ratio of β cells in regenerating versus control islets is indicated. (G) Blood glucose measurements of non-ablated larvae (gray) and larvae in which β cells were ablated from 3-4dpf (red) (n=3). (H,I) Confocal projections of β cell lineage-marked islets in 5-dpf control and 1-dpa Tg(ins:Cre); Tg(hs:CSH); Tg(ins:Flag-NTR) larvae. β cells were labeled by inducible H2B-GFP at 3dpf before ablation and stained for GFP (green) and insulin (red). (J,K) Confocal planes of ablated (J) and regenerating (K) islets in Tg(ins:Flag-NTR); Tg(gcga:GFP); Tg(ins:dsRed) larvae. Red arrow in K indicates gcga:GFP+ ins:dsRed+ β cells in regenerating islet. (L-N) Confocal planes of Tg(gcga:Cre); Tg(hs:CSH); Tg(ins:Flag-NTR) islets labeled by H2B-GFP before ablation, and stained for GFP (green), insulin (red) and glucagon (blue). α cells are indicated by white arrows and β cells by the red arrow. (L) 6-dpf non-ablated islet, (M) 4-dpf ablated islet at 0dpa, and (N) 6-dpf islet at 2dpa. H2B-GFP+ regenerating β cells are indicated with yellow arrows. (O) Quantification of H2B-GFP+ and H2B-GFP β cells in 2-dpa islets (n=10). ***P≤0.001 (Student′s t-test). EXPRESSION / LABELING:
|
|
δ cells, but not regenerating β cells, are lineage marked by sst2:Cre. (A-A′′′) Merged and single-channel images of 5-dpf Tg(sst2:Cre); Tg(hs:CSH); Tg(ins:Flag-NTR) islets that were heat shocked at 3dpf and stained for GFP (green), insulin (red) and somatostatin (white). Somatostatin+ δ cells are labeled by H2B-GFP. (B-C′′′) Merged and single-channel images of 5-dpf non-ablated (B) or 1dpa (C) Tg(sst2:Cre); Tg(hs:CSH); Tg(ins:Flag-NTR) islets that were heat shocked at 3dpf and stained for GFP (green), insulin (red) and DNA (blue). (D) Quantification of total somatostatin+, somatostatin+/H2B-GFP+, insulin+, and insulin+/H2B-GFP+ cells in non-ablated 5-dpf Tg(sst2:Cre); Tg(hs:CSH); Tg(ins:Flag-NTR) islets. 45% of somatostatin+ cells and 1.5% of insulin+ cells are marked by sst2:Cre (n=15). (E) Quantification of insulin+ and insulin+/H2B-GFP+ cells in 5-dpf regenerating islets. 1% of insulin+ cells are marked by sst2:Cre (n=9). |
|
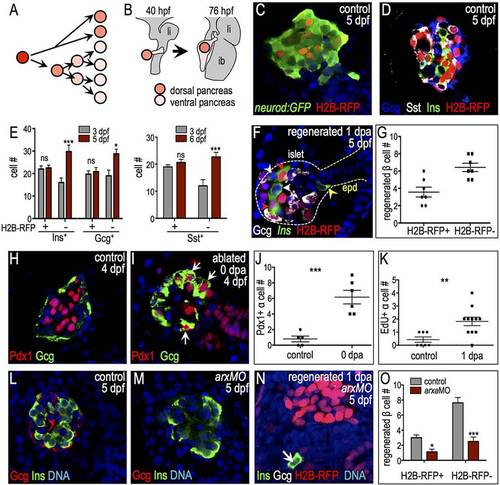
α-to-β cell transdifferentiation can be marked by the label-retaining cell (LRC) assay in the zebrafish principal islet. (A,B) Schematic of the LRC assay. (A) Zygotes were injected with H2B-RFP mRNA. Fluorescent signal from H2B-RFP protein was diluted by mitosis. (B) The LRC assay marks quiescent, early differentiated pancreatic endocrine cells derived from the dorsal bud. li, liver; ib, intestinal bulb. (C,D) Confocal planes of H2B-RFP-labeled 5-dpf islets. (C) TgBAC(neurod1:EGFP) (n=4). (D) Wild-type islet stained for insulin (green), glucagon (blue) and somatostatin (white) (n=5). (E) Quantification of H2B-RFP+ and H2B-RFP cells expressing insulin, glucagon and somatostatin (ne3 for all). (F) H2B-RFP-labeled regenerating islet of 5-dpf/1-dpa Tg(ins:CFP-NTR) larva stained for CFP (insulin, green) and glucagon (white). Red arrowheads indicate H2B-RFP+ regenerating β cells, white arrowheads indicate H2B-RFP regenerating β cells in the islet, and yellow arrowhead indicates H2B-RFP β cells in the extra-pancreatic duct region (epd). (G) Quantification of 1-dpa H2B-RFP+ and H2B-RFP β cells (n=7). (H,I) Confocal planes showing Pdx1 (red) and glucagon (green) expression in 4-dpf non-ablated (H) and ablated (I) islets. Pdx1+ α cells are indicated by arrows. (J) Quantification of α cells expressing Pdx1 in 4-dpf non-ablated (n=5) and ablated (n=6) islets. (K) Quantification of proliferating (EdU+) α cells in 5-dpf non-ablated and 1-dpa islets (ne7 islets examined). (L,M) Confocal planes showing glucagon (red) and insulin (green) staining in control MO-injected (L) and arxaMO-injected (M) 5-dpf larvae. Glucagon+ cells are absent from arxa morphant islets. (N) Confocal projection of arxaMO-injected 5-dpf/1-dpa Tg(ins:CFP-NTR) islet labeled with H2B-RFP lacking most β cell regeneration. Arrow indicates regenerated β cell. (O) Quantification of 1-dpa β cells in control MO-injected (gray, n=16) and arxaMO-injected (red, n=19) islets. *Pd0.05, **Pd0.01, ***Pd0.001; ns, not significant (Student′s t-test in J,K; two-way ANOVA followed by Bonferroni post-test in E,O). |
|
glucagon is required for islet development. (A) Endodermal organs isolated from 4-dpf larvae. p, pancreas; li, liver; ib, intestinal bulb. (B) qPCR of insulin (ins) and glucagon (gcga) in control and ablated larvae. ins expression was diminished and gcga expression transiently increased during regeneration (n=3 independent experiments). (C-E) gcgaMO blocks glucagon protein expression and increases the α to β cell ratio. (C-D′′) Confocal projections of 5-dpf control MO-injected (C) and gcgaMO-injected (D) Tg(gcga:GFP); Tg(ins:dsRed) larvae stained for glucagon (red). (E) Quantification of gcga:GFP+ α cells and ins+ β cells in control MO-injected (n=15) and gcgaMO-injected (n=10) islets. (F) Quantification of H2B-RFP+ and H2B-RFP β cells at 3 and 5dpf in control MO-injected (ne3) and gcgaMO-injected (n=5) islets. Ventral bud-derived H2B-RFP β cells are specifically diminished in gcga morphants. *P≤0.05, **P≤0.01, ***P≤0.001; ns, not significant (two-way ANOVA followed by Bonferroni post-test). |
|
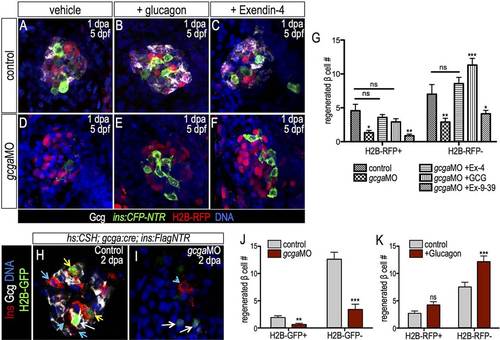
Differential regulation of β cell progenitor pools by glucagon gene products. (A-F) Confocal projections of 1-dpa H2B-RFP-labeled Tg(ins:CFP-NTR) control islets (A-C) and gcgaMO-injected islets (D-F) that were treated with vehicle (A,D), recombinant glucagon (B,E) or Ex-4 (C,F). Islets were immunostained for CFP (insulin, green) and glucagon (white). β cell regeneration was restored with glucagon or Ex-4 injection, but not with Ex-9-39 injection. (G) Quantification of H2B-RFP+ and H2B-RFP β cell number in control regenerating (n=7) and gcgaMO-injected regenerating islets treated with vehicle (n=9), glucagon (n=13), Ex-4 (n=12) or Ex-9-39 (n=17). (H,I) Confocal planes of 1-dpa Tg(gcga:Cre); Tg(hs:CSH); Tg(ins:Flag-NTR) control and gcgaMO-injected regenerating islets stained for glucagon (white) and insulin (red). α cells were labeled (white arrows) at 3dpf by H2B-GFP before MTZ treatment. Yellow arrows indicate H2B-GFP+ β cells and blue arrows/arrowhead indicate H2B-GFP β cells. (J) Quantification of H2B-GFP+ and H2B-GFP β cells in regenerating control (n=10) and gcgaMO-injected (n=13) islets. (K) Quantification of H2B-RFP+ and H2B-RFP β cells in regenerating islets treated with vehicle or glucagon (n=14). *P≤0.05, **P≤0.01, ***P≤0.001; ns, not significant (two-way ANOVA followed by Bonferroni post-test in G; Student′s t-test in J,K). EXPRESSION / LABELING:
|
|
Differential regulation of β cell progenitor pools by glucagon and glucose. (A,B) Confocal projections of Tg(ins:CFP-NTR) islets with 1-day treatment with mannose (osmolality control, A) or glucose (B) and staining for CFP (insulin, green) and glucagon (red). (C) Quantification of insulin+ cells showed that glucose treatment increases β cell mass (n=18). (D,E) Confocal projections of 5-dpf/1-dpa H2B-RFP mRNA-injected islets that were treated with mannose (D) or glucose (E) during regeneration and stained for CFP (green) and glucagon (white). (F) Quantification of H2B-RFP+ and H2B-RFP β cells in control (n=7) and glucose-treated (n=7) islets shows a specific increase in the H2B-RFP population. (G-J) Confocal projections of 5-dpf/1-dpa Tg(ins:CFP-NTR) islets injected with H2B-RFP mRNA alone (G) or co-injected with gcgaMO (H-J). Samples were treated with vehicle (G,H), glucose (I) or glucagon (J). (K) Quantification of H2B-RFP+ and H2B-RFP cells from islets in control (n=27), gcgaMO (n=15), gcgaMO+glucose (n=17), gcgaMO+glucagon (n=22) treatments. Only glucagon rescued H2B-RFP+ β cell regeneration. (L) Model integrating distinct roles of glucagon in β cell formation. Loss of β cells triggers α cell proliferation and activation of glucagon. Increased output of glucagon and GLP-1 drives regeneration from two sources: (a) glucagon/GLP-1 acts autonomously in α cells to permit their transdifferentiation to β cells; and (b) glucagon/GLP-1 acts non-autonomously through intermediates (e.g. liver-derived glucose) to drive β cell formation from duct-associated progenitors. *P≤0.05, **P≤0.01; ns, not significant (Student′s t-test in C,F; one-way ANOVA followed by Tukey′s post-hoc test in K). EXPRESSION / LABELING:
|


