
- Title
-
A Spinal Opsin Controls Early Neural Activity and Drives a Behavioral Light Response
- Authors
- Friedmann, D., Hoagland, A., Berlin, S., Isacoff, E.Y.
- Source
- Full text @ Curr. Biol.

Effect of Light on Frequency of Spontaneous Coiling Behavior (A) Still frames from a movie of a single spontaneous coil in a 27 hpf embryo. (B) Trace of detected motion (pixel changes) from video of an individual embryo before (dark) and during (508 nm) illumination; peaks represent individual coiling events. (C) Raster plot of coiling events measured simultaneously in 44 dark-adapted 22.5 hpf embryos under dark and light conditions. (D) Left, peristimulus time histogram of 22.5 hpf embryos from data in (C). Right, histogram of the same fish at 27 hpf. Frequency is mean coils/fish within bins of 2.4 s. (E) Mean (±SEM) baseline coiling frequencies (coils/s) in the dark (black bars) and under green light (gray bars) over developmental time. Two-tailed paired t test with Bonferroni adjusted p values, p < 0.001; n = 39–75. (F) Photoinhibition [(HzLight HzDark) / HzDark; coiling measured over 120 s in each condition] as a function of wavelength. Gray squares are individual responses <3 SD from each mean (black lines). Light power = 133–159 nW/mm2; n = 96. (G) Photoinhibition of coiling frequency by light flashes of indicated durations. Lines indicate normalized mean, bins = 4 s; SEM in gray; n = 96. See also Figure S1. |
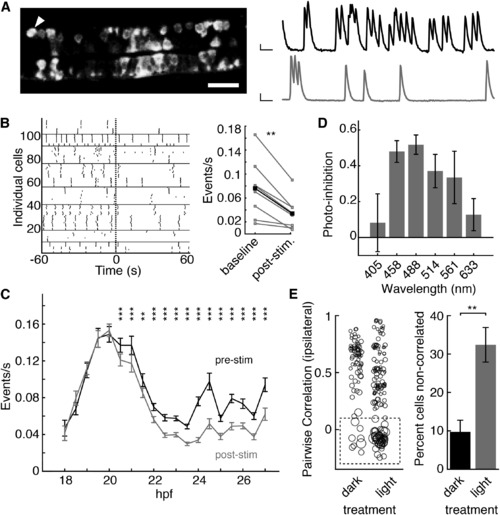
Acute and Delayed Effects of Light on Neural Activity (A) Left, image of GCaMP5 fluorescence in ventral spinal cord somites 3–8 of a 1020:Gal4; UAS:GCaMP5 embryo. Scale bar, 20 µm. Right, calcium traces from one cell (arrowhead in image) under 2P (black trace, 920 nm) or subsequent period of 1P (gray trace, 488 nm) excitation, after <5 s interval. Axes: 100% ΔF/F, 10 s. (B) Left, raster plot of 2P-imaged calcium events in 24 hpf embryos before and after a 5 s flash (dashed line) with 561 nm light. Measurements from each of eight fish (horizontal lines delineate individual fish). Right, quantification of calcium event frequency in the eight fish (gray lines; black line, mean) during a 180 s period under 2P excitation (baseline) and over 60 s after the 561 nm light flash (post-stim). Two-tailed paired t test p < 0.01. (C) Frequency (mean ± SEM) of calcium events over 9 hr of development measured under 2P excitation before (pre-stim) and after (post-stim) a 5 s 561 nm light flash, as quantified in (B). Two-tailed paired t test, Bonferroni adjusted p values, p < 0.001, p < 0.01; n = 21–123 cells from four to eight fish at each age. (D) Photoinhibition (mean ± SEM) after illumination with a 5 s light flash at varying wavelengths. 103–110 µW/pixel; n = 16 cells in eight fish at each wavelength. (E) Left, pairwise ipsilateral correlations between cells in 22 hpf embryos after dark or light (508 nm, 13.2 µW/mm2) rearing for 2 hr before 20 hpf. Circle size proportional to event width at half max amplitude (range = 1.8–75.7 s). Dashed box demarcates noncorrelated cells. Right, percentage (±SEM) of noncorrelated cells (ipsilateral correlation <0.1) at 22 hpf. Two-tailed unpaired t test, p = 0.004. n = 6 (dark) and n = 8 (light) fish. See also Figure S2. |

Light Inhibition of Coiling Depends on an Extraretinal Opsin (A and B) Representative peristimulus time histograms of coiling frequency (events/s; mean across six trials; bin = 1 s) of embryos at 22–25 hpf (A) or 27–31 hpf (B). Zygotes injected with scrambled control morpholino (n = 23 in A, 34 in B) (black) or morpholino against VALopA (n = 24 in A, 41 in B) (gray). (C) Left, mean photoinhibition (±SEM) of scrambled control morpholino (sc; n = 40) and morpholino (mo; n = 55) -injected 22–25 hpf embryos. Two-tailed unpaired t test, p < 0.001. Right, frequency distribution of percent photoinhibition (six responses per fish) in scrambled control morpholino embryos (black) and morpholino embryos (gray). (D) Normalized inhibition or excitation (mean ± SEM) of coiling frequency [ (HzLight HzDark) / HzDark] in the first 12 s after light onset relative to a 120 s preceding baseline in darkness (n = 39–75). (E) Mean photoinhibition (±SEM; five responses per fish) of morpholino-injected embryos mosaically expressing low, intermediate, or high levels of a VALopA rescue construct with a mCerulean marker. One-way ANOVA with Tukey post hoc analysis, p < 0.05, p < 0.01; n = 59 (low), 18 (intermediate), and 11 (high). (F) Images of representative embryos expressing low, intermediate, and high levels of mCerulean fluorescence. Scale bar, 200 µm. See also Figure S3. |