
|
Fig. 1
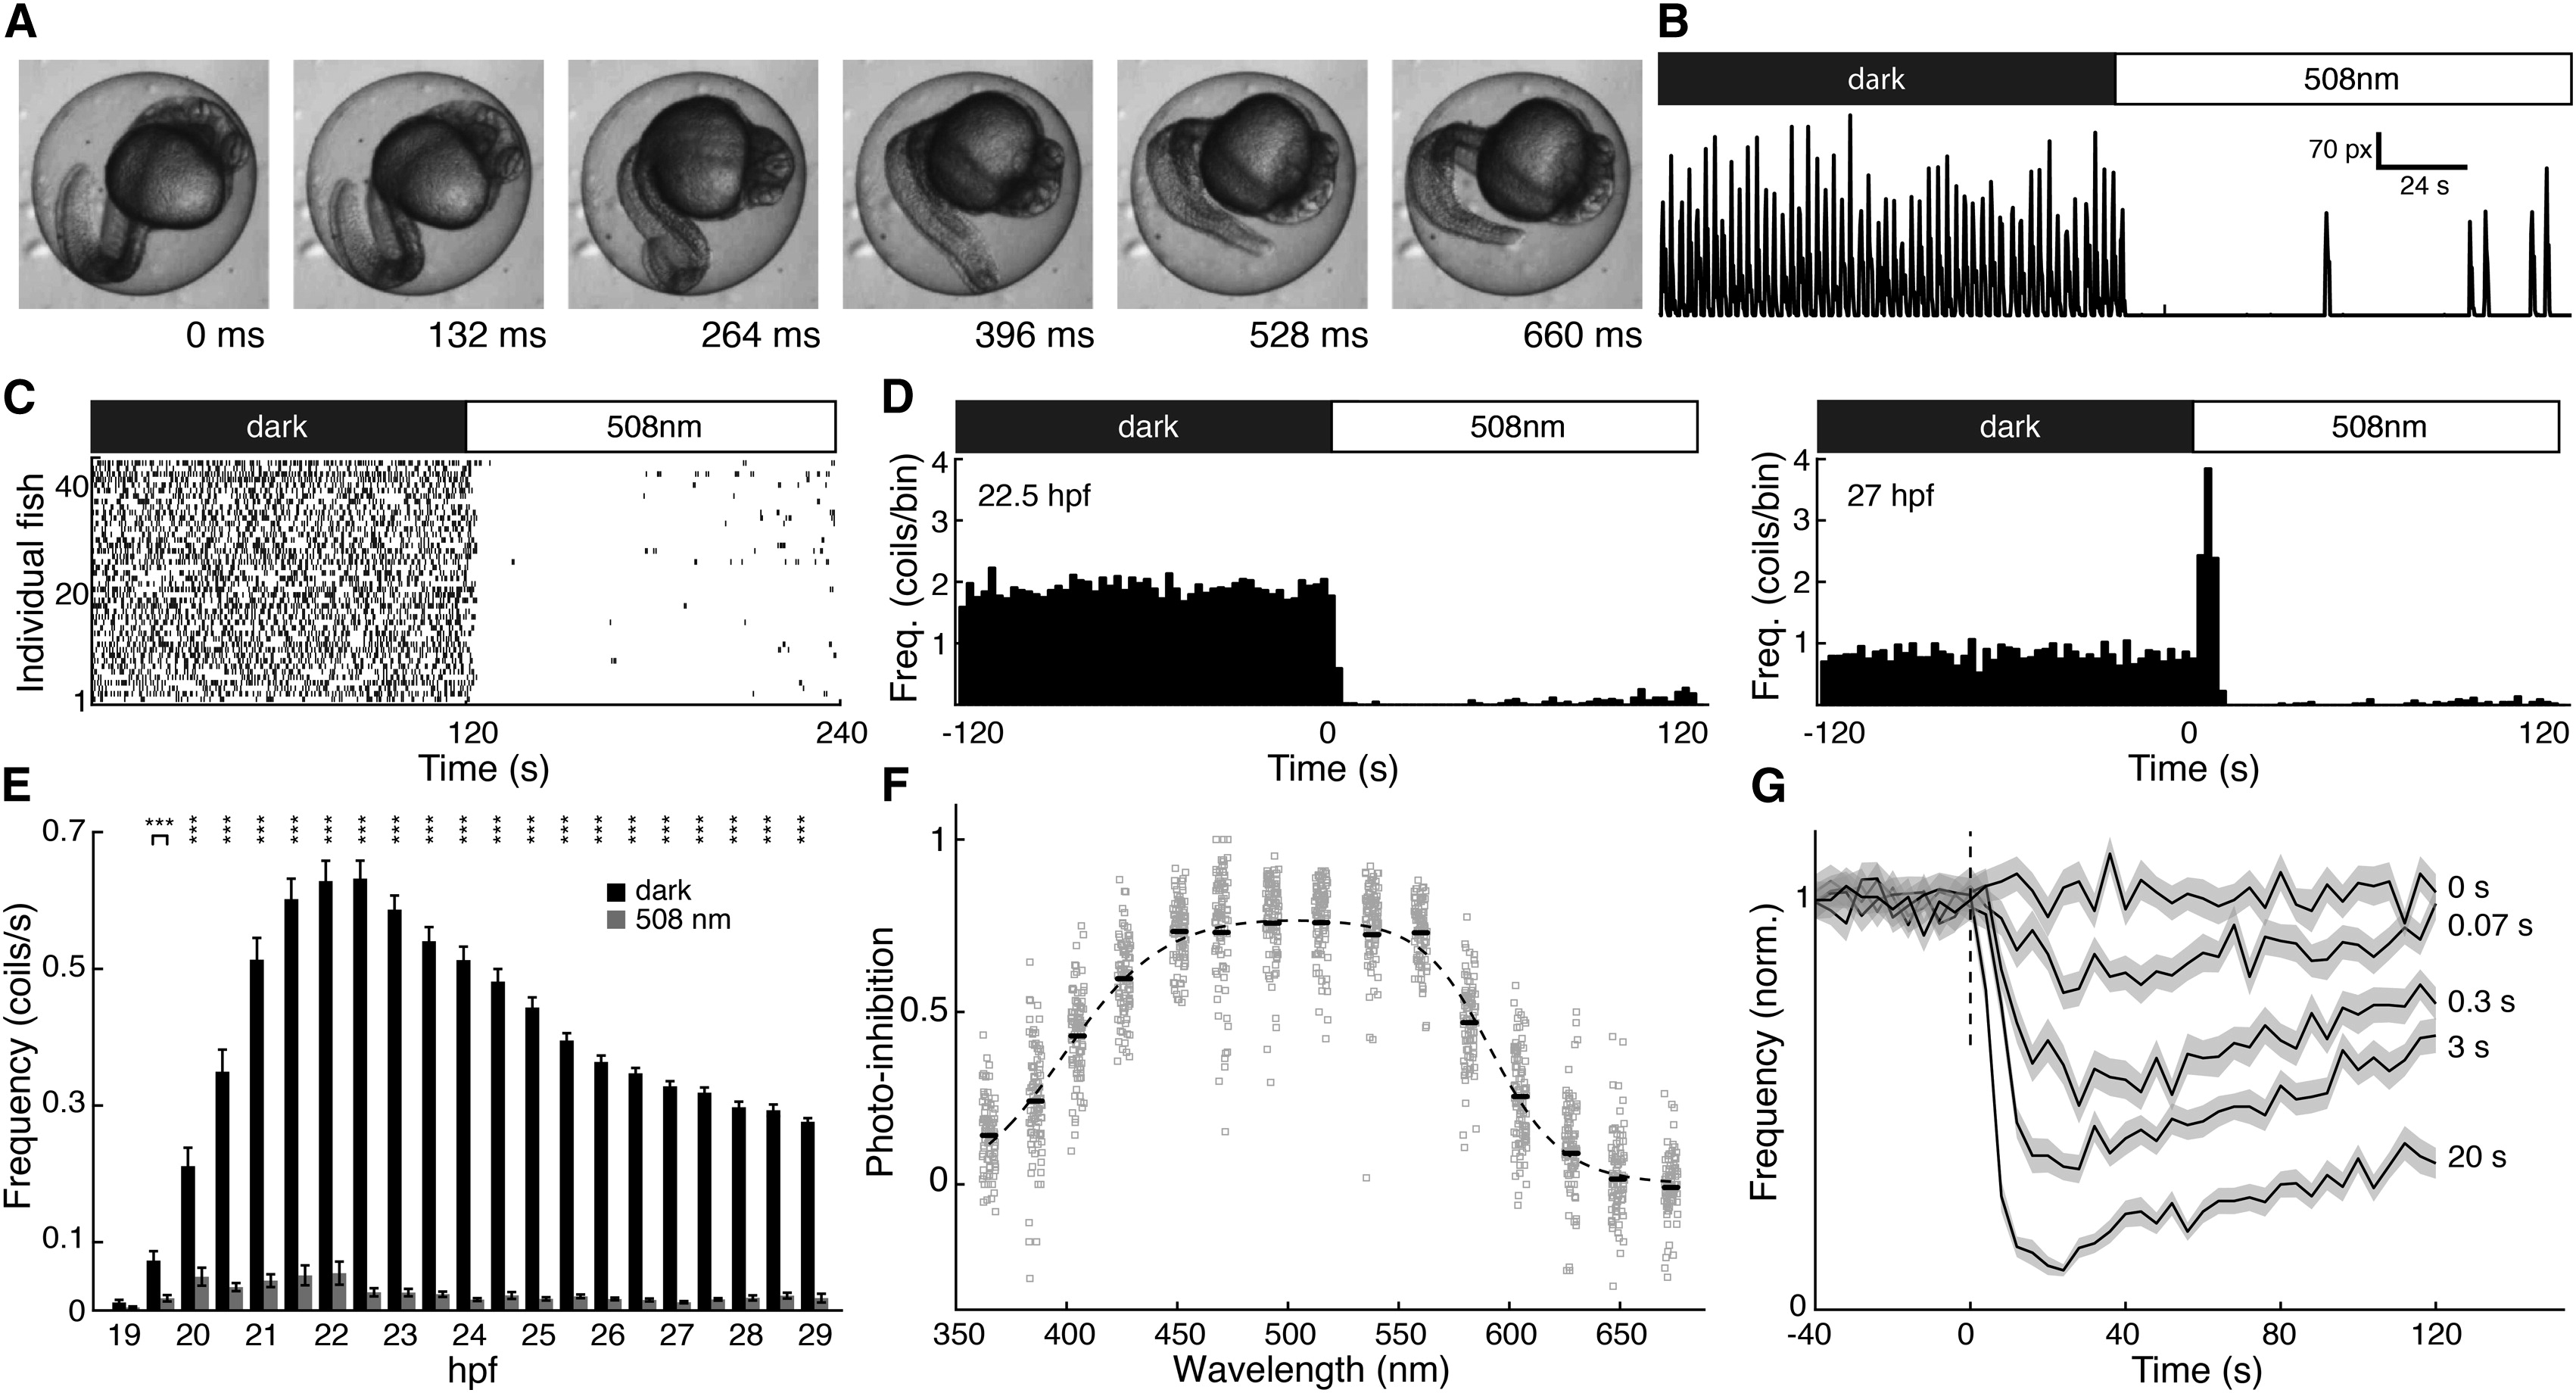
Effect of Light on Frequency of Spontaneous Coiling Behavior
(A) Still frames from a movie of a single spontaneous coil in a 27 hpf embryo.
(B) Trace of detected motion (pixel changes) from video of an individual embryo before (dark) and during (508 nm) illumination; peaks represent individual coiling events.
(C) Raster plot of coiling events measured simultaneously in 44 dark-adapted 22.5 hpf embryos under dark and light conditions.
(D) Left, peristimulus time histogram of 22.5 hpf embryos from data in (C). Right, histogram of the same fish at 27 hpf. Frequency is mean coils/fish within bins of 2.4 s.
(E) Mean (±SEM) baseline coiling frequencies (coils/s) in the dark (black bars) and under green light (gray bars) over developmental time. Two-tailed paired t test with Bonferroni adjusted p values, p < 0.001; n = 39–75.
(F) Photoinhibition [(HzLight HzDark) / HzDark; coiling measured over 120 s in each condition] as a function of wavelength. Gray squares are individual responses <3 SD from each mean (black lines). Light power = 133–159 nW/mm2; n = 96.
(G) Photoinhibition of coiling frequency by light flashes of indicated durations. Lines indicate normalized mean, bins = 4 s; SEM in gray; n = 96.
See also Figure S1.